
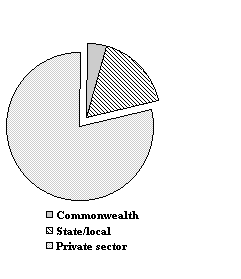
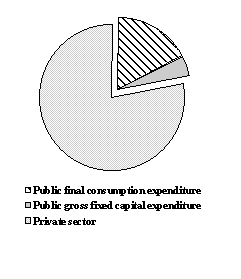
As shown in Chart A1, the public sector directly accounts for around 26 per cent of total employment (excluding the armed forces) and 22 per cent of final domestic demand [4]. The State/local level accounts for about 77 per cent of total public sector civilian employment and 72 per cent of public final demand - reflecting its major responsibilities for service delivery, for example in the areas of education and health, and for infrastructure.
| CHART A1: CONTRIBUTION OF PUBLIC AND PRIVATE SECTORS | |
| Total employment, August 1996 | Domestic Demand, 1995-96 |
| 
|
Source: ABS 5206.0 and unpublished ABS data
Within the total public sector, the general government sector is substantially larger than the PTE sector, accounting for 61 per cent of public sector output and 80 per cent of public sector civilian employment. The PTE sector is nevertheless an important provider of economic infrastructure. In terms of assets, the largest Commonwealth PTEs are Telstra and Australia Post. Major State PTEs include authorities responsible for electricity, gas and water services.
There are significant differences in the roles and responsibilities of the levels of government, as shown in Chart A2. Major outlays functions performed by the Commonwealth include defence expenditure and transfer payments in relation to social security and welfare and health. The Commonwealth also has a major role in funding education and health services provided by the States and the private sector. Major State/local functions include the delivery of education, health, and public order and safety services.
CHART A2: COMMONWEALTH AND STATE/LOCAL OUTLAYS BY MAJOR FUNCTION, 1995-96
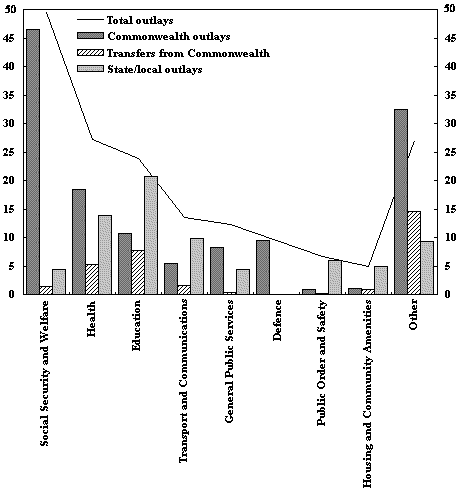
In 1995-96, the Commonwealth raised 73 per cent of total general government revenue. However, adjusted Commonwealth own purpose outlays only directly accounted for 62 per cent of total general government outlays. A significant share of Commonwealth revenue is passed on to the State/local level in the form of grants, which account for 42 per cent of State/local general government revenue. Further information on inter-governmental transfers is provided in Budget Paper No. 3.


