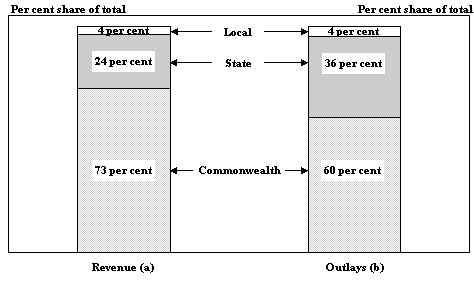
Chart 3: Composition of General Government Own-Source Revenue and Adjusted Own-Purpose Outlays, 1996-97 (estimated)
(b) The ABS measure of general government own-purpose outlays excludes payments to other levels of government and public trading enterprises (PTEs), such as general revenue assistance, SPPs and advances and subsidies, and interest payments on borrowings for other governments and PTEs. The adjusted measure adds back in to Commonwealth outlays SPPs 'through' the States (other than those for local government purposes). A corresponding adjustment is made to the State/local series. The adjusted measures for both Commonwealth and State levels of government abstract from all net advances, which is consistent with measures of the underlying deficit.
Source: ABS, Government Finance Statistics, unpublished data.
As noted above, there is a substantial flow of funds from the Commonwealth to supplement the own-source revenues of State/local government. The significance of this flow for Commonwealth general government outlays and State/local general government revenue is shown in Chart 4. Payments to other levels of government (excluding SPPs 'through' the States except for local government general purpose assistance grants) accounted for around 20 per cent of the total outlays of the Commonwealth general government sector in 1996-97. These payments also accounted for around 37 per cent of the total revenue of the State general government sector and for around 19 per cent of the total revenue of the local general government sector.
Chart 4: Impact of Commonwealth General Government Payments to Other Levels of Government, 1996-97 (estimated)(a)
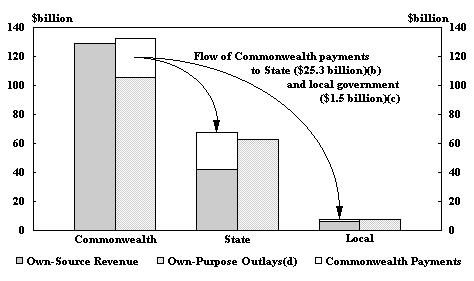
(b) Excludes grants 'through' the States.
(c) Comprises grants made 'through' the States to local government and direct payments to local government.
(d) Commonwealth grants 'through' the States, except grants for local government purposes, have been treated as Commonwealth government own-purpose outlays.
Source: ABS, Government Finance Statistics, unpublished data.
The pattern of Commonwealth and State revenue raising and expenditure responsibilities is longstanding. The most significant difference is in relation to taxation and results primarily from the introduction of uniform Commonwealth income taxation in 1942 to maximise revenue to finance the war effort. Both the Commonwealth and the States have the legal capacity to levy taxes, the only exception being customs and excises which the Australian Constitution reserved for the Commonwealth. The States derive own-source revenue from a range of sources, the most important of which are payroll taxes and taxes on property, including stamp duty.
A degree of imbalance between the revenue raising and expenditure responsibilities of different tiers of government is characteristic of the fiscal arrangements of most federal systems of government. There are considerable advantages to Australia as a whole, from both an economic and an administrative perspective, from the maintenance of a national taxation system. In Australia, a certain level of VFI is also necessary if the Commonwealth is to distribute payments to the States in accordance with the principle of horizontal fiscal equalisation. The provision of grants to the States in the form of SPPs is a means for the Commonwealth to pursue its policy objectives in areas where the States are the primary service providers.
The extent of VFI has often been criticised on the grounds that it reduces government accountability and the amount and certainty of State revenue. Accountability is considered to be best served when the level of government responsible for expenditure is also responsible for funding that expenditure through taxes. In practice, however, State governments are accountable for their budgetary decisions at the margin. The States raise around 55 per cent of their total revenue, and increases in State expenditures have to be financed largely through increased State taxation. Financial market scrutiny also has a bearing on a government's accountability for its spending decisions.
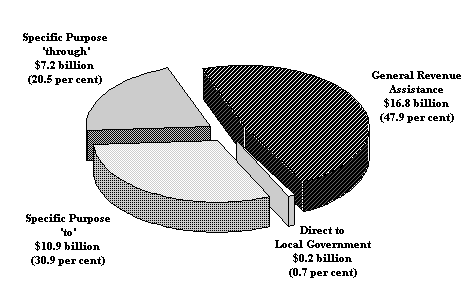
Chart 5: Payments to the State/Local Sector in 1997-98 (estimated) Total Gross Payments $35.2 billion