| |
STATEMENT 2 — ECONOMIC AND FISCAL OUTLOOK
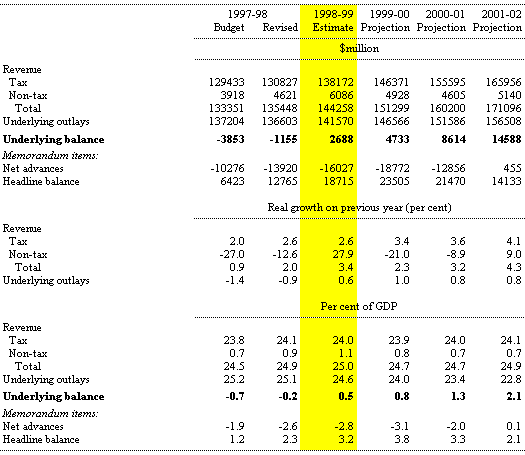
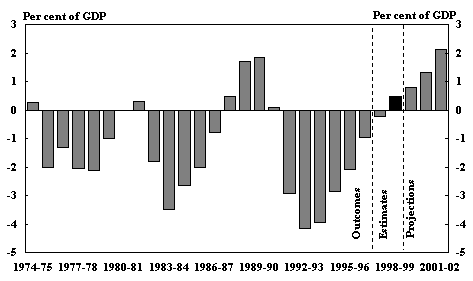
The underlying balance is expected to be in surplus by $2.7 billion or 0.5 per cent of GDP in 1998-99 — the first surplus since the early 1990s. Increasing surpluses are projected for the outyears, consistent with the medium term fiscal strategy (see Table 3). By 2001-02, the underlying budget balance is projected to be in surplus by around 2 per cent of GDP, a turnaround of over 4 per cent of GDP on the $10.3 billion deficit in 1995-96.
The large headline surpluses in prospect reflect both the move into underlying budget surplus and equity asset sale proceeds, including those from the Government’s decision to sell the Commonwealth’s remaining equity in Telstra.
Table 3: Summary of Budget Aggregates
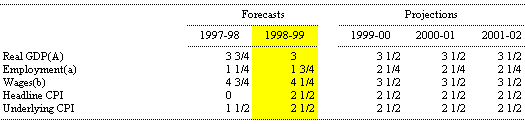
The economic forecasts and projections underpinning the budget estimates are discussed in detail in Part I of this Statement and the major economic parameters are presented in Table 4.
Table 4: Major Economic Parameters (percentage change from previous year)
 (a) Labour Force Survey basis.
(b) Average earnings (national accounts basis).
The projections for the period from 1999-2000 to 2001-02 are prepared solely as a basis for Budget figuring and do not represent forecasts.
A range of factors may change the budgetary outlook in future years. Appendix A contains a Statement of Risks which details risks that may have a material effect on the fiscal outlook. One factor influencing the fiscal outlook will be variations in the economic parameters. A discussion of the estimated sensitivity of the outlays and revenue estimates to changes to the economic parameters is provided in Appendix B to this Statement.
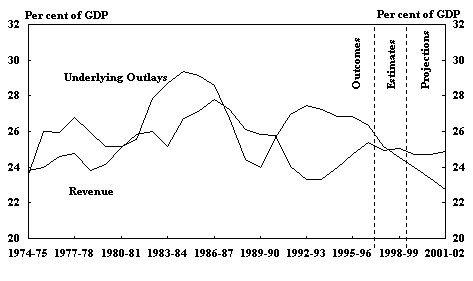
As shown in Chart 8, improvements in the underlying balance derive principally from falls in underlying outlays as a proportion of GDP. By 2001-02 they are expected to reach 22.8 per cent of GDP — their lowest level since the early 1970s. This reflects the focus placed by the Government on outlays restraint in implementing its programme of fiscal consolidation in the 1996-97 and 1997-98 Budgets. Revenue as a proportion of GDP is expected to remain relatively stable over the forward estimates period. The tax burden projected over that period is lower than in the late 1980s, when underlying surpluses were last recorded.
Chart 8: Underlying Budget Aggregates
Panel A: Budget Sector Revenues and Outlays
Panel B: Underlying Budget Balances
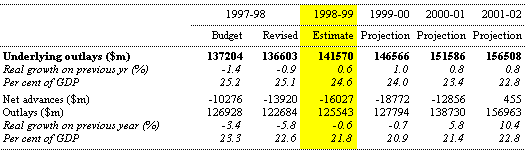
Table 5 provides estimates of budget sector outlays for 1997-98 to 2001-02.
Table 5: Estimates of Budget Sector Outlays
Over the period 1998-99 to 2001-02, underlying outlays are expected to:
Headline outlays (ie underlying outlays plus net advances) decrease slightly in real terms in 1998-99 and 1999-2000, but increase strongly thereafter. The decreases in earlier years reflect the proceeds from asset sales (particularly receipts from the sale of the Commonwealth’s remaining equity in Telstra) which decline sharply in 2001-02.
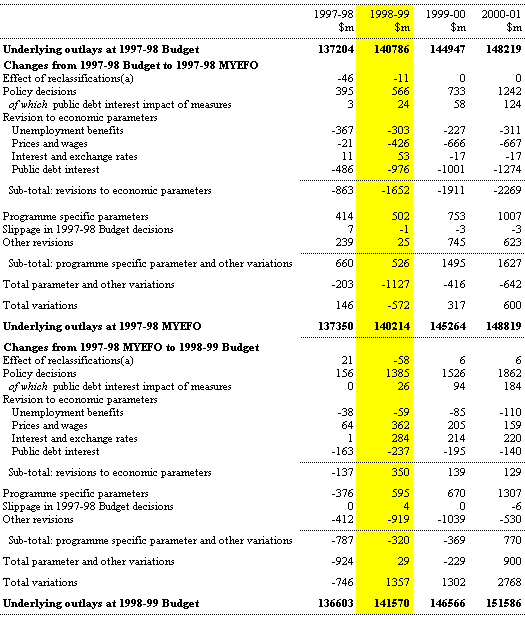
Table 6 reconciles the outlays estimates between the 1997-98 Budget, the 1997-98 MYEFO and the 1998-99 Budget in terms of policy decisions and parameter and other variations.
Table 6: Reconciliation of Changes to Budget Sector Underlying Outlays since the 1997-98 Budget
 (a) See Appendix E for details on classification changes.
The outlook for underlying outlays was broadly unchanged between the 1997-98 Budget and the MYEFO. Lower numbers of unemployment beneficiary recipients, an improved outlook for inflation and lower public debt interest payments reduced outlays significantly in all years. These were only partially offset by higher outlays as a result of adverse changes to programme specific parameters (associated with higher than expected levels of Disability Support Pension and a higher than expected demand for medical services by veterans and dependants) and other estimates variations.
Since the MYEFO, the estimates for underlying outlays have been increased for all years other than 1997-98. In 1998-99 and 1999-2000, the increases primarily reflect the impact of new policy decisions while, in 2000-01, there is also a significant contribution from net parameter variations including, specifically, further adverse changes in programme specific parameters. While programme specific parameter variations also contribute to higher outlays in 1998-99 and 1999-2000, these factors are more than offset by other estimates variations including the regular drawdown in the conservative bias allowance.
The major influence on programme specific parameters has been an increase in the estimated number of clients seeking disability support payments. Other factors affecting programme specific parameter changes reflect increases in client numbers and/or higher average rates payable on family payments.
Over the full year since the 1997-98 Budget, in total, the outlays estimates have increased in all years except 1997-98, generally reflecting the cost of policy decisions which, in 1998-99 and 1999-2000, more than offset significant public debt interest savings. In 2000-01, both policy decisions and parameter variations, over the past year, contribute to the estimated increase in outlays.
Conservative Bias Allowance
The forward estimates are based on decisions already made and economic projections. They also include an allowance for the established tendency for spending on existing Government policy (particularly for demand-driven programmes) to be higher than estimated. This allowance, known as the conservative bias allowance (CBA), is included in the forward estimates at the beginning of each budget year and gradually reduced as the budget estimates are finalised so that the Budget year CBA is zero.
At the time of the 1997-98 Budget, the CBA was based on 0.75 per cent of headline outlays in the first forward year, increasing in each following year. Following a review of the accuracy of this allowance, this figure was increased to 1.0 per cent of underlying outlays in the first forward year, increasing in each following year. The increases were factored into the 1997-98 MYEFO estimates.
Since the MYEFO, further adjustments have been made to the CBA in 2000-01 and 2001-02 to improve the overall accuracy of underlying outlays in the outyears.
Outlays Measures
The 1996-97 and 1997-98 Budgets provided for substantial net outlays savings over the budget and forward estimates period. The 1998-99 Budget provides for some moderate net new policy spending.
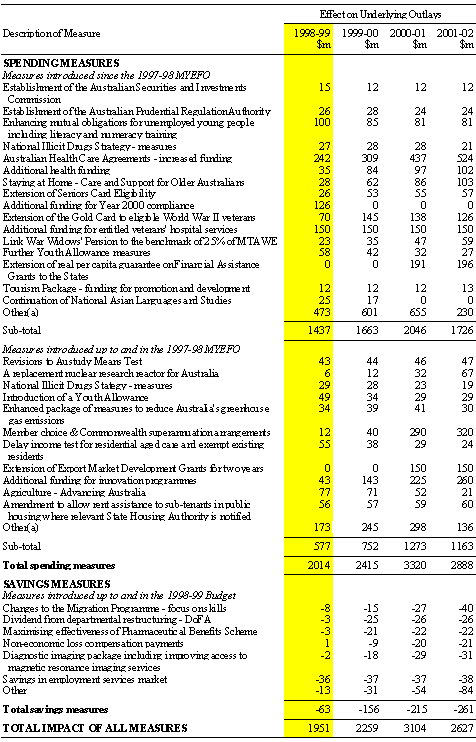
Table 7 provides a summary of the major outlays measures affecting underlying outlays.
Major new outlays spending measures since the 1997-98 Budget include:
Despite the considerable savings already identified in the 1996-97 and 1997-98 Budgets, additional savings have been identified in a number of areas including:
A full description of all 1998-99 Budget outlays measures can be found in Part I of Budget Paper No. 2.
Table 7: Major Outlays Measures Introduced Since the 1997-98 Budget
 (a) Includes public debt interest impact of decisions.
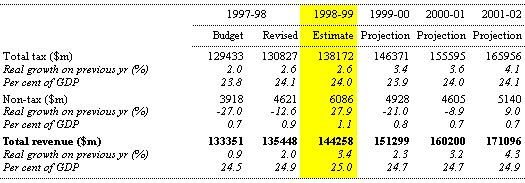
Table 8 provides estimates of budget sector revenues for the period from 1997-98 to 2001-02.
Table 8: Summary of Budget Sector Revenue
Over the period 1998-99 to 2001-02, total revenue is expected:
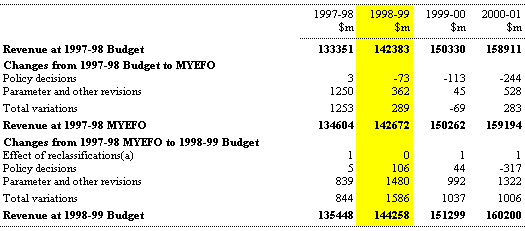
Table 9 reconciles revenue estimates at the time of the 1997-98 Budget, the 1997-98 MYEFO and the 1998-99 Budget in terms of policy decisions and parameter and other variations.
Table 9: Reconciliation of Budget and Forward Estimates of Revenue in Aggregate
 (a) See Appendix E for details on classification changes.
At the time of the MYEFO, the revenue estimates were revised upwards for all years except 1999-2000. While policy decisions reduced estimated revenues in all years from 1998-99, this effect was — with the exception of 1999-2000 — more than offset by parameter and other revisions.
Variations in the period since the 1997-98 MYEFO improve the revenue outlook in all years. Policy decisions since MYEFO have only a minor positive impact in 1998-99 and 1999-2000 and detract from revenues thereafter. Parameter and other variations are the primary factor driving revenues higher in all years. Within tax revenues, these principally reflect increases in anticipated other individuals tax receipts. In 1998-99, there is also a significant positive contribution from non-tax revenues, including higher dividend receipts.
Overall, there have been only moderate increases to the revenue estimates since the 1997-98 Budget, amounting to $1.9 billion in 1998-99, $1.0 billion in 1999-2000 and $1.3 billion in 2000-01.
Revenue Measures
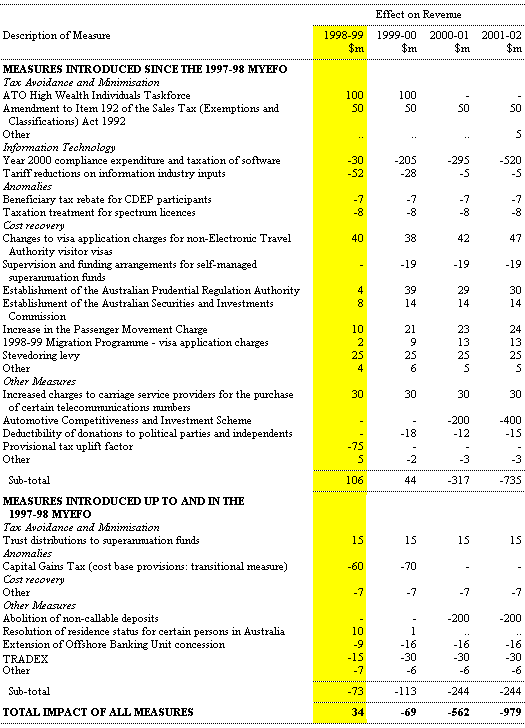
In keeping with the Government’s commitments, the 1998-99 Budget does not introduce new taxes or increase existing taxes.
Table 10 provides a summary of the major revenue measures. Key revenue measures include:
A full description of all 1998-99 Budget revenue measures can be found in Part II of Budget Paper No. 2.
Table 10: Summary of Revenue Measures Introduced Since the 1997-98 Budget
budgetary implications of the Sale of Telstra
The sale of the Commonwealth’s remaining equity in Telstra has been included in the budget figuring throughout the budget papers, in accordance with the Government’s decision to seek an electoral mandate to fully privatise the telecommunications carrier. This section explicitly identifies current estimates of the expected budgetary impact.
While the proceeds of equity asset sales affect only headline outlays — and the headline balance — there are indirect implications for the underlying balance from debt servicing cost savings associated with the use of proceeds to reduce Commonwealth general government net debt, dividends forgone and the costs of sale.
The estimates of the impact of the sale are highly dependent on assumptions made regarding: the structure, timing and proceeds of the sale; expected sale costs; dividends forgone; yield assumptions; and financial management strategies. It is assumed that all proceeds are used to reduce Commonwealth general government net debt. The current estimates will change as processes for the sale are progressed, and should not be seen as committing the Government to a specific sale process or timing.
Table 11 provides estimates of the potential budgetary implications of the sale of the Commonwealth’s remaining equity in Telstra as included in the current budget and forward estimates.
Table 11: Budgetary Impact of Sale of Two Thirds of Telstra
(a) Includes both interest effects and dividends forgone.
(b) A negative figure on balance items indicates a deterioration in the underlying budget balance.
The following assumptions have been made:
Any change to the assumed sale arrangements underpinning the analysis can be expected to affect the budget and forward estimates.
As shown in Table 11, the effect of the Telstra sale in the outyears is for positive net income effects to broadly offset initial sale costs. Positive interest effects can be expected to be large and to peak beyond the forward estimates period.
The Government’s decision to sell the Commonwealth’s remaining equity in Telstra is based not on the budgetary effects, but rather on broader economic considerations.
The Government believes that the sale of the Commonwealth’s remaining equity in Telstra will provide an unprecedented opportunity for Australians to buy into — and share in the benefits deriving from — a strongly performing Australian company.
The Government believes that sale of equity in Telstra represents an historic opportunity to reduce Commonwealth net debt.
 |
 |