| |
In accordance with the requirements of the Charter of Budget Honesty, and the UPF for the consistent presentation of financial information, this appendix provides, on a GFS consistent basis:
Commonwealth General Government Sector
This section presents estimates of the underlying balance — and the revenue and outlays components — for the Commonwealth general government sector. A description of this sector and its relationship to the budget sector can be found in Appendix E.
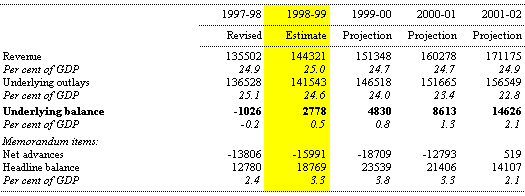
Table F1 is presented on the same basis as the budget sector estimates provided elsewhere in the Budget papers so as to provide an estimate of the underlying balance broadly consistent with the ‘public net lending’ concept in the national accounts. Estimates for underlying balances in Table F1 will differ from the deficit estimates in Table F2 because the former do not take account of increases in provisions (see discussion in Appendix E).
Table F1: Summary of General Government Aggregates ($m)
Table F1 shows that the Commonwealth general government sector underlying balance is expected to move into surplus in 1998-99, consistent with expected movements in the budget sector. The general government sector underlying balance is projected to strengthen further in the following years with the surpluses continuing to grow as a percentage of GDP.
This section presents Commonwealth financial data on a GFS basis, consistent with the UPF. Five statistical tables are presented below, showing:
The tables were produced by the Department of Finance and Administration in consultation with the ABS. The ABS sign convention is adopted, where a negative deficit represents a surplus. This is in contrast to the presentation of the budget balance elsewhere in this document where a negative balance represents a deficit.
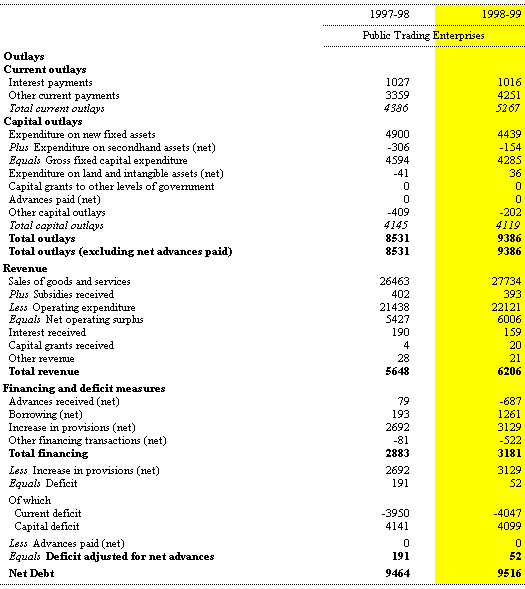
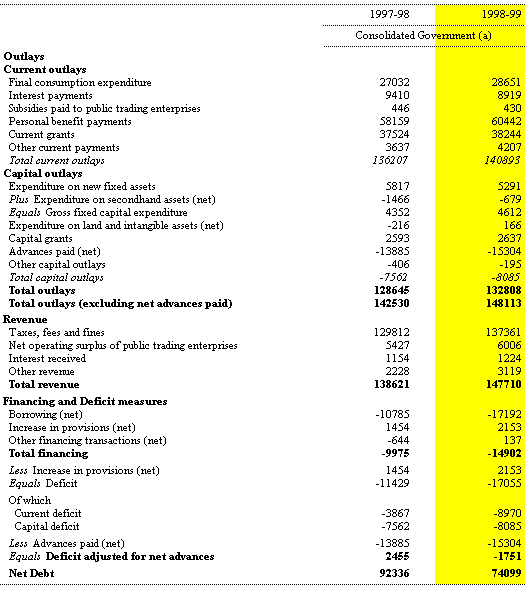
Consistent with ABS practice, transactions between the Commonwealth general government and PTE sectors are included in Table F2 and Table F3 but are removed from Table F4 as they are internal transactions within the Commonwealth non-financial public sector. Table F4 records the net operating surplus of the PTE sector as part of the revenue of the Commonwealth government sector. This is irrespective of whether that net operating surplus is actually remitted to the parent government.
Transactions between the Commonwealth non-financial and PFE sectors are included in all tables. These transactions include income transfers such as dividends paid to general government, net advances paid by general government to PFEs and taxes paid by PFEs. Any unremitted elements of PFE net operating surplus are excluded from Table F4.
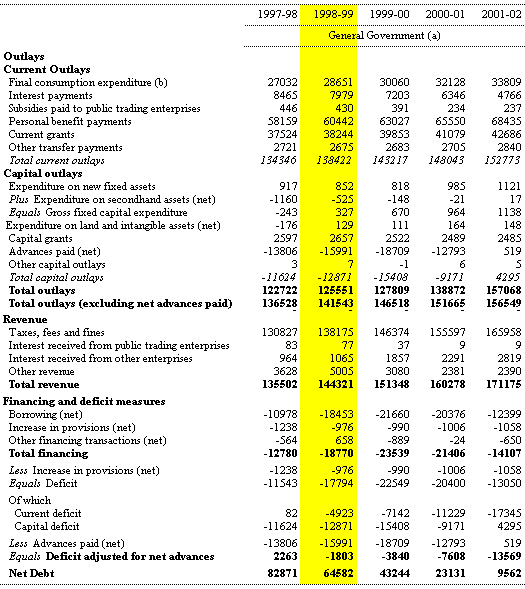
The general government deficit adjusted for net advances shown in Table F2 differs from the underlying deficit measure used elsewhere in the Budget Papers in that it is adjusted for increases in provisions in respect of PTE superannuation. The two measures also differ as a result of the different treatment of certain transactions noted in Appendix E. As noted in Appendix E, the treatment of net advances in these tables differs from GFS.
Net debt in GFS is the excess of gross debt (including deposits held, advances received and other borrowings) over selected financial assets (including cash and deposits, advances paid and other lending). The net debt measure is limited in that it does not include accrued employee liabilities, other financial assets and liabilities (particularly equity holdings), and physical assets.
The net debt data in Tables F2 to F4 are based on historical capital values, with movements driven principally by cash transactions such as borrowings and receipts of equity sales. Net debt is calculated as the stock of net debt in the previous year plus the deficit adjusted for net advances plus net equity transactions. The 1996-97 base net debt figures have been obtained from the ABS publication Public Sector Financial Assets and Liabilities, 30 June 1997 (Cat. No. 5513.0).
Table F2: Economic Transactions of Commonwealth Government ($m)
(a) The general government sector is the combination of the budget and non-budget sectors after elimination of transactions internal to that sector and adjustments to the budget sector as outlined in Appendix E.
(b) Includes an allowance for parameter revisions contained in the budget sector contingency reserve.
Table F3: Economic Transactions of Commonwealth Government ($m)
Table F4: Economic Transactions of Commonwealth Government ($m)
(a) The consolidated Commonwealth sector is the combination of the general government and PTE sectors after elimination of transactions internal to that sector.
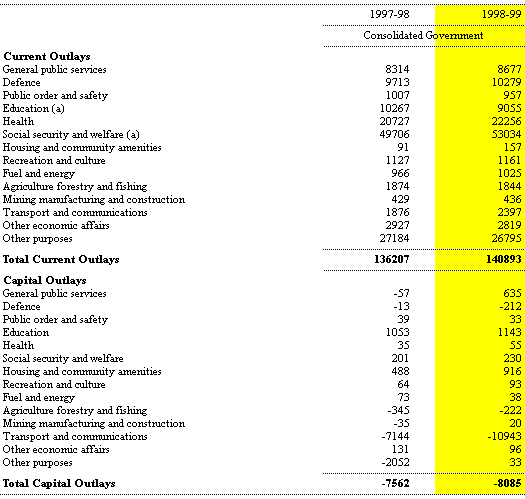
Table F5: Outlays by Purpose of Commonwealth Government ($m)
(a) From 1 July 1998, it is proposed that payments under the AUSTUDY programme will be replaced by the Youth Allowance (for students aged under 25 years). This involves a transfer of outlays estimates from the Education function to the Social Security and Welfare function.
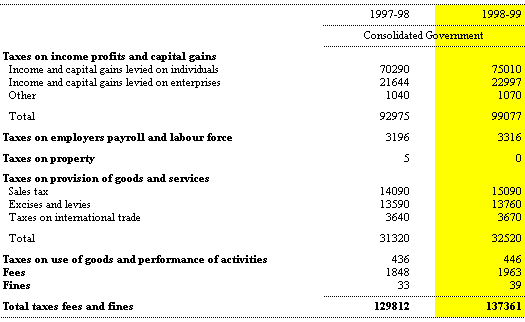
Table F6: Taxes, Fees and Fines of Commonwealth Government ($m)
 |
 |