



|
|
|
|
This appendix provides historical data for Commonwealth fiscal aggregates.
Table A1 provides details of the cash revenue, outlays and surplus for the period 1969-70 to 1999-2000. Table A2 provides details of tax, non-tax and total revenue on a cash basis for the period 1969-70 to 1999-2000.
Estimates up to and including 1998-99 are on cash terms, while those for 1999-2000 are cash proxies derived from an accrual framework. Due to methodological and data-source changes associated with the move to an accrual accounting framework, time series data which encompasses measures derived under both cash and accrual accounting should be used with caution.
There are other structural breaks within the data set prior to the shift to accrual reporting. Classification differences and revisions, as well as changes to the structure of the budget, can impact on comparisons over such an extended period.
Following recent changes to the Australian National Accounts standards, the general government surplus measures in this appendix, from 1998-99 onwards, incorporate payments by the Commonwealth general government sector in respect of accumulated PNFC superannuation liabilities. Figures for the years prior to 1998-99 do not incorporate these payments.
Other factors which affect the comparability of fiscal aggregates between years include:
While approximate adjustments can be made to identify trends in budget aggregates on a generally consistent basis, the further back the analysis is taken, the less manageable the task becomes.
Table A3 provides details of Commonwealth general government net debt from 1974-75 to 1999-2000.
Table A4 looks at Commonwealth net worth by sector, from 1996-97 to 1999-2000.
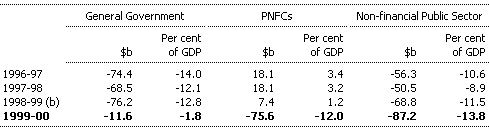
Tables A5 to A7 provide details of Commonwealth accrual fiscal aggregates for the period 1996-97 to 1999-2000 for the general government sector, the public non-financial corporations (PNFC) sector, and the non-financial public sector.
Table A1: Commonwealth general government sector cash revenue, outlays and surplus(a)
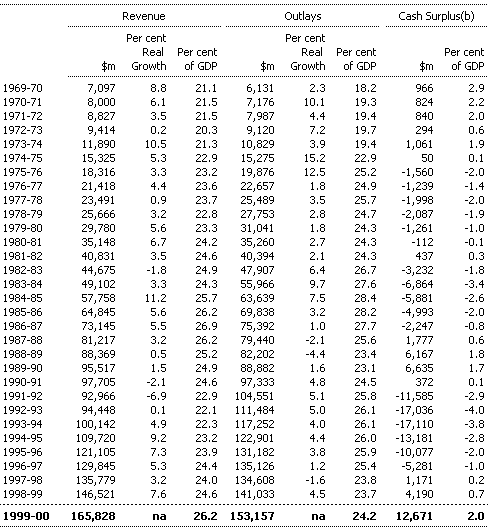
(a) There is a break in the series between 1998-99 and 1999-00.
Data for the years up to and including 1998-99 are consistent with the cash
ABS GFS reporting requirements. From 1999-00 onwards, data are derived from
an accrual ABS GFS reporting framework, with revenues proxied by receipts from
operating activities and sales of non-financial assets, and outlays proxied
by payments for operating activities and purchases of non-financial assets.
Due to methodological and data-source changes associated with the change, time
series data which encompasses measures derived under both cash and accrual accounting
should be used with caution.
(b) Following recent changes to the Australian National
Accounts standards, the surplus measures in this table, from 1998-99 onwards,
incorporate payments by the general government sector in respect of accumulated
PNFC superannuation liabilities. Payments prior to 1998-99 do not incorporate
these payments.
Table A2: Commonwealth general government sector cash taxation revenue, non-taxation revenue and total revenue(a)
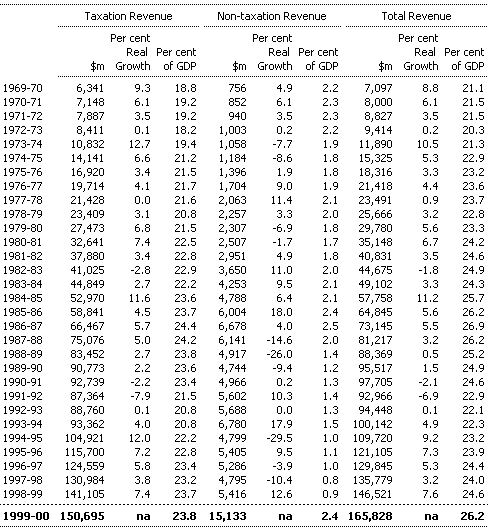
(a) There is a break in the series between 1998-99 and 1999-00. Data for the years up to and including 1999-99 are consistent with the cash ABS GFS reporting requirements. From 1999-00 onwards, data are derived from an accrual ABS GFS reporting framework, with total revenue proxied by receipts from operating activities and sales of non-financial assets. Due to methodological and data-source changes associated with the change, time series data which encompasses measures derived under both cash and accrual accounting should be used with caution.
Table A3: Commonwealth general government net debt (as at end of financial year)(a)
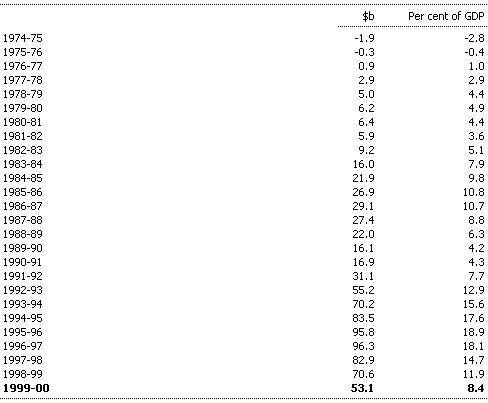
(a) The net debt series used in this table incorporates Treasury estimates for the period 1974-75 to 1986-87 and published ABS data for the period 1987-88 to 1999-2000 (Public Sector Financial Assets and Liabilities, Cat. No. 5513.0). Comparable net debt data have been collected by the ABS only since 1988. Treasury estimates were constructed by deducting annual net borrowing - defined as the ABS cash deficit - from the ABS measure of the stock of net debt at end June 1988.
Table A4: Commonwealth net worth by sector (as at end of financial year)(a)
(a) Net worth is calculated as assets minus liabilities minus
shares and other contributed capital.
(b) The changes in net worth over 1999-2000 are largely
attributable to the revaluation of Telstra at market rather than book value.
Table A5: Commonwealth general government sector GFS revenue, GFS expenses and fiscal balance
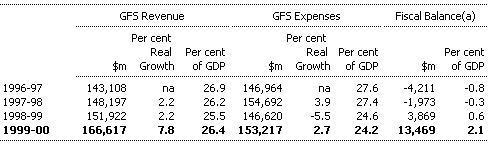
(a) Fiscal balance equals GFS revenue less GFS expenses less
net acquisitions of non-financial assets.
na Data not available.
Table A6: Commonwealth PNFC GFS revenue, GFS expenses and fiscal balance
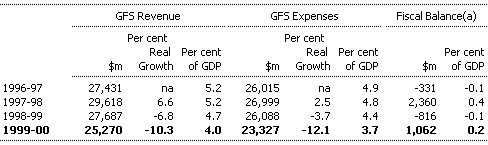
(a) Fiscal balance equals GFS revenue less GFS expenses less
net acquisitions of non-financial assets.
na Data not available.
Table A7: Commonwealth NFPS GFS revenue, GFS expenses and fiscal balance
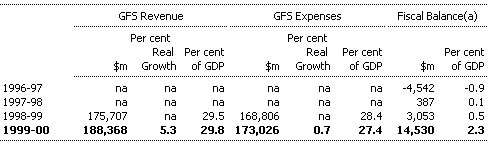
(a) Fiscal balance equals GFS revenue less GFS expenses less
net acquisitions of non-financial assets.
na Data not available.
