|
|




Table 2: Australia's ODA 1971-72 to 2001-02
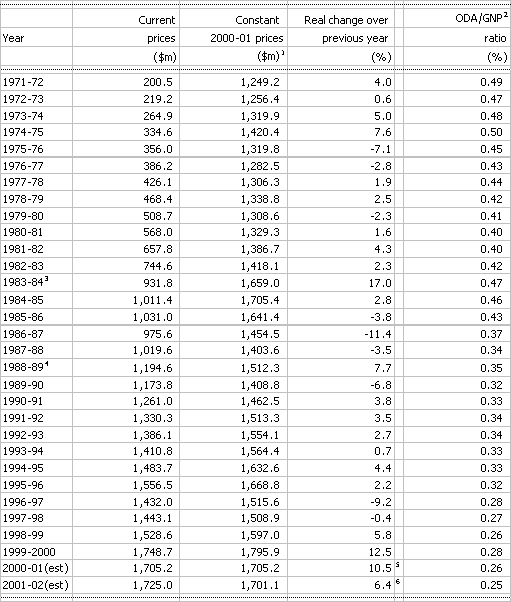
Diagram 14:DAC member countries' ODA/GNP ratios 2000
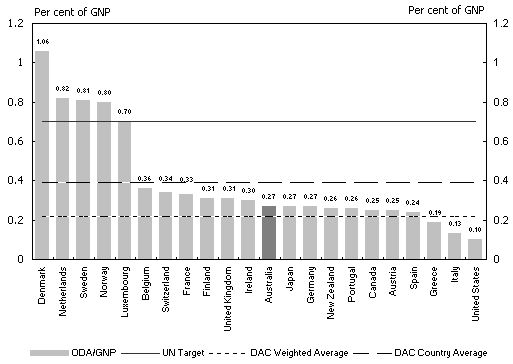
Diagram 15:DAC member countries' net ODA 2000
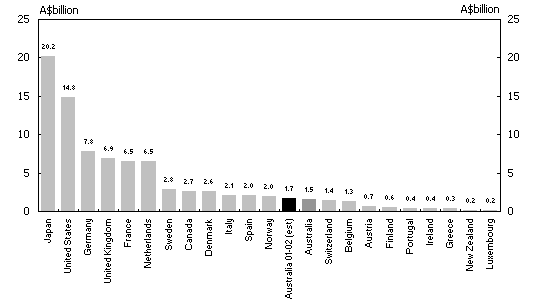
Source: DAC preliminary figures for Diagrams 14 and 15. Australia's net ODA in Diagram 15 sourced from AusAID estimates.
Diagram 16:Total net resource flows to aid recipient countries1
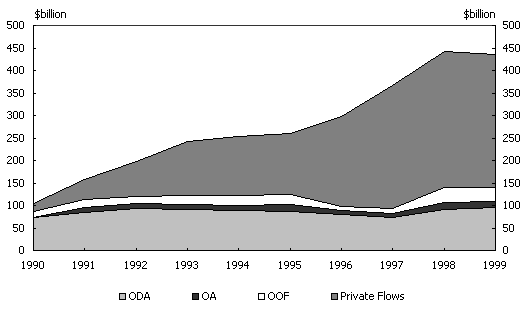
Table 3:Total aid flows to aid recipients not detailed in Table 1 ($m)
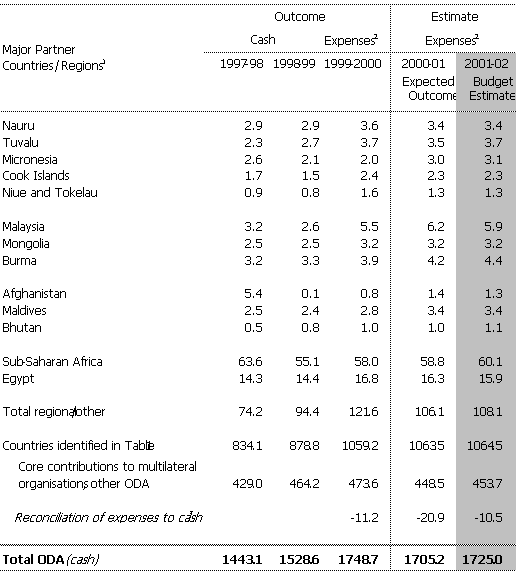
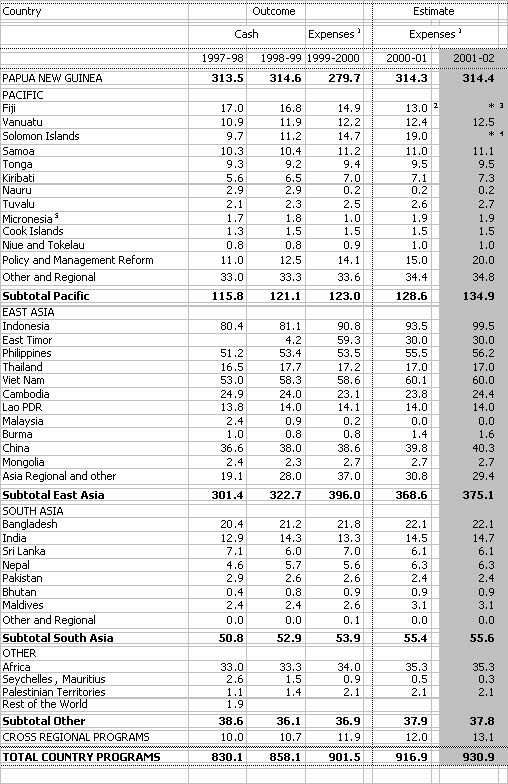
Table 4:Country programs expenditure and allocations ($m)
Table 5: Global programs expenditure and allocations ($m)
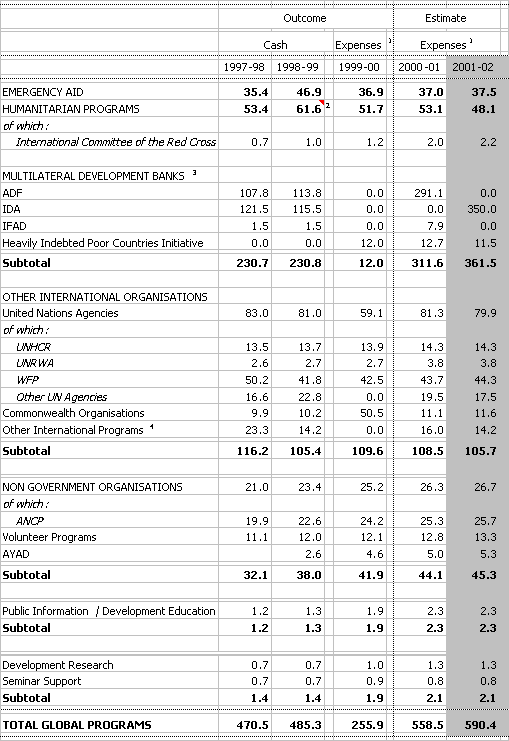
Table 6: Total ODA by subprograms ($m)
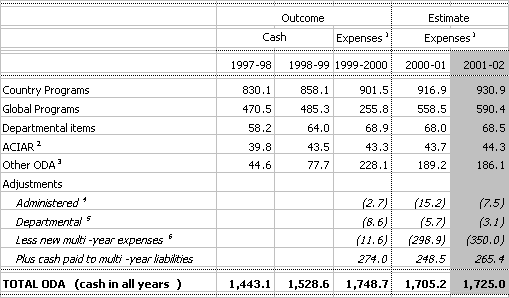
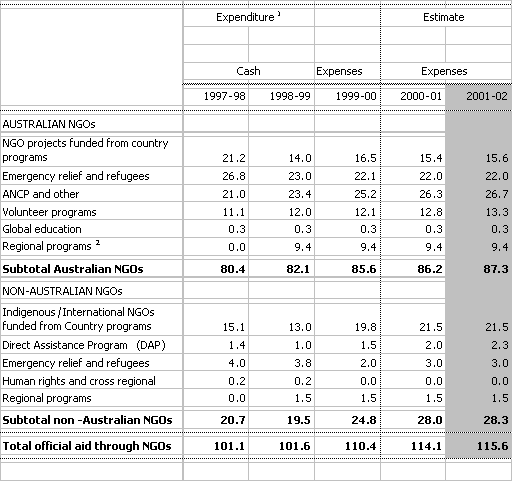
Table 7: Official aid through Australian and non-Australian NGOs ($m)
Table 8: Developing country students supported by the aid program1
In this Budget Statement, all figures prior to 1999-2000 are in cash terms (i.e. the amount of cash paid out in a particular year). The Government moved to an accrual budgeting framework in 1999-2000, and subsequently, budget allocations (e.g. Tables 4 and 5) are presented in terms of expenses. Multi-year liabilities, such as payments to the Asian Development Fund, International Development Association and International Fund for Agricultural Development are recorded as an expense at the time of signing the Instrument of Commitment/Contribution, not when the cash is paid out. This accounting treatment is used in AusAID's financial statements, available in the Foreign Affairs and Trade Portfolio Budget Statement on the Internet at http://www.dfat.gov.au/dept/budget.
Total ODA estimates for 1999-2000 onwards (e.g. in Table 1) are adjusted from an expense basis by excluding the expenses booked for new multi-year commitments and including the cash paid for those same agreements. Minor adjustments are also made for things such as movements in creditors and depreciation.
Estimates of sectoral expenditure are in cash terms throughout. Total ODA continues to be measured in terms of cash. A number of tables in this Budget statement include an "accrual adjustment" figure prior to calculating ODA. This figure includes adjustments for depreciation, investment, and expected net change in creditors. Table 6 also details the adjustments required to multi-year liabilities, such as the multilateral development banks, to convert expenses to cash.
Apart from those individual allocations affected by multiyear liabilities, the difference between cash and expenses is quite small. The differences can be summarised as follows:
This Budget statement contains two sorts of figures for 2000-01 and 2001-02 - allocations and estimates.
Tables 4 and 5 reflect the decisions taken by the Minister for Foreign Affairs at budget time to allocate expenses to various programs for 2001-02. These allocations are used by AusAID to manage the aid program and include items such as individual country programs, the emergency program, and the AusAID/NGO Cooperation Program (ANCP).
Other tables are based on estimates. These are published due to the interest associated in figures such as total aid going to any individual country (not just the country program), or the amount spent in any particular sector (such as education, governance or health). In estimating future expenditure or expenses, these figures are less reliable than allocations.
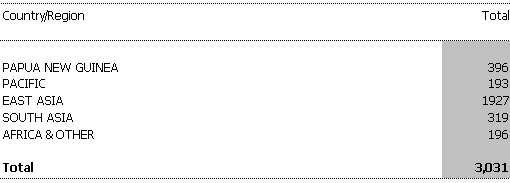
In estimating total aid flows, AusAID begins with budget allocations for particular countries (specific country program allocations). To these are added estimates of expenditure from `regional' and `global' programs that do not have country allocations specified at budget time. Such estimates reflect previous expenditure patterns, and are subject to change throughout the year. Estimated total aid flows also include ODA expenditure by other Government departments.
While the sectors identified by the Government in Better Aid for a Better Future are high priorities for the Australian aid program, centralised allocations are generally not made for expenditure on a particular sector. Programming decisions are made on the basis of individual country strategies that are developed in consultation with partner governments, addressing their priority needs.
Expenditure in any particular sector is thus the result of numerous programming decisions, made in accordance with Government policy but not determined at budget time. Estimates published in this Budget statement are qualified and are subject to programming decisions throughout the year.
Sectoral expenditure estimates are reflective of past trends in expenditure recorded in AusAID's Activity Management System (AMS) for 1999-2000 and 2000-01. The AMS tracks planned and actual expenditure on individual projects. Each project is allocated sector codes, in accordance with DAC guidelines, which reflect the primary focus of the project, as well as attributing secondary codes to track indirect expenditure. The 2000-01 expenditure was extracted from the AMS in February, including planned expenditure to the end of the year, and was adjusted to account for over-programming. To this was added estimates for sectoral flows from multilateral organisations, based on these organisations' reports. Further information relating to the value of imputed flows from multilateral organisations can be obtained from the Statistical Services Section of AusAID (ph. +61 2 6206 4000).
Expenditure on the cross-cutting issues of environment and gender overlaps with expenditure on other sectors and should not be compared on the same basis.
Other figures estimated (rather than allocated) by methods similar to those outlined above include total flows through NGOs (which includes desk estimates of expenditure on NGOs funded through country programs) and progress against the food security pledge.
1 Based on GDP(E) Implicit Price Deflators provided by the ABS, which have recently been rebased to 1998-99.
2 This column compares ODA to GNI, not GNP, but the two measures are very similar. In late 1998, the Australian Bureau of Statistics changed its method of calculating GNI resulting in all historical measures of GNI, GNP and GDP being revised upwards and, consequently, ODA/GNP ratios revised downwards.
3 Australian Government contributions towards costs of educating private students from developing countries in Australian tertiary and secondary educational institutions were included in ODA for the first time in 1983-84.
4 In 1988-89 there was a one-off bringing forward of multilateral development bank payments, increasing 1988-89 but decreasing 1989-90 ODA expenditure.
5 This represents a real per cent increase over the 1999-2000 budget figure of $1,502.0 million (at 2000-01 constant prices).
6 This represents a real per cent increase over the 2000-01 budget figure of $1,599.3 million (at 2000-01 constant prices) as detailed in Table 1.
1 Policy and Management Reform funding is included in the total aid flows to individual Pacific countries.
2 See Technical Notes for an explanation of the relationship between expenses and cash.
3 See Technical Notes for an explanation of the relationship between expenses and cash.
1 See Technical Notes for an explanation of the relationship between expenses and cash.
2 In 2000-01, Fiji's aid program was reduced by around 30 per cent, from an estimated $18.6 million to around $13 million. Most non-humanitarian activities were suspended or terminated, including all new scholarships and a range of public sector projects. However, health, basic education, and small-scale projects aimed at helping the poorer sections of the Fiji community will continue. Aid sanctions were designed to have minimal impact on the poor, while providing maximum incentive for the return to constitutional democracy.
3 Fiji allocation and total flows to be determined within the overall Pacific allocation.
4 Solomon Islands allocations and total flows to be determined within the overall Pacific allocation.
5 For the purposes of this table, Micronesia includes the Federated States of Micronesia, Palau, and the Republic of the Marshall Islands.
1 See Technical Notes for an explanation of the relationship between expenses and cash.
2 Includes $4 million additional Humanitarian program carryover.
3 From 1999-2000 onwards, only new commitments to the Asian Development Fund, IFAD and HIPC are recorded as expenses. See Chapter 4 for details of 2001-02 cash contributions to these organisations.
4 Other international programs include the Global Environment Facility, MPMF, International Tropical Timber Organisation and international health programs. See Chapter 4 for details of 2001-02 cash contributions to these organisations.
1 See Technical Notes for an explanation of the relationship between expenses and cash.
2 ACIAR's figure equals their total cash expenditure. ACIAR's full financial statements are available in the Foreign Affairs and Trade Portfolio Budget Statement at http://www.dfat/gov.au/dept/budget.
3 Other ODA includes ODA eligible activities by State Governments and Commonwealth Agencies other than AusAID and ACIAR. Included, for example, are capital contributions to multilateral development banks, funded by Treasury appropriations, or assistance to East Timor provided by the Australian Federal Police Service.
4 Includes adjustments for non-ODA eligible Administered expenditure such as revenue items, fringe benefits tax, and other non-ODA eligible expenditure. In 2000-01, this figure also includes an operating loss of $6.636 million due to rationalisation of payments to multilateral organisations (this change in accounting treatment required a one-off increase in expenses in 2000-01 with no corresponding cash requirement).
5 Includes adjustments for non-ODA eligible Departmental expenditure such as receipts under Section 31 of the FMA Act, interest earned on bank deposits, departmental carryover, the net increase in aid program creditors and depreciation.
6 Refer to the explanation of multiyear liabilities in the Technical Notes.
1 Expenditure for 1997-98 through to 1999-2000 corresponds to figures published in NGO annual reports.
2 Regional Programs are a sub-set of Country Programs first separated in 1998-99.
1 Includes partially aid funded East Timorese students who have been offered `free' places by Universities in Australia. Australia is providing funding through DETYA to assist with living allowances for these students. There are expected to be 56 students in this category studying in Australia next year.
1 Australian 2000-01 estimate shown in 1998-99 constant prices (deflated).