



How population, participation and productivity interact
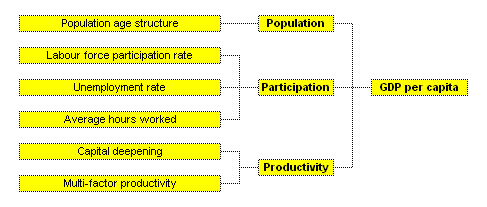
In assessing longer-term trends in economic growth and growth in Australian living standards, it is useful to look behind these major aggregates and consider some fundamental influences on the economy. One approach considers trends in population, labour force participation and productivity that make up the productive capacity of the economy (Chart 1). Box 1 briefly defines the key terms in this approach, and flags some important conceptual and measurement issues.
Chart 1: The components of GDP per capita growth
In Australia's case, trends in population, participation and productivity have all pulled together to produce strong growth in GDP per person over the past decade or so.
Population trends over recent years have featured a rising proportion of the population in traditional working age groups (15 to 64 years). This has been the first part of a transition that started with the substantial decline in birth rates experienced in the 1960s and 1970s. The decline in the birth rate meant that the youth dependency ratio, that is the ratio of people below working age to those of working age, declined. The second part of the transition will see a rise in coming decades in the age dependency ratio, as the number of those above 65 rises relative to those aged 15 to 64. Among those of working age, there will be a rising proportion in the 55 to 64 years age group.
Box 1: Participation, productivity, GDP per person and wellbeing: some terminology Participation is the total number of hours worked per person of working age. In Australia, working age is defined as 15 years and over; whereas, the OECD (and many of its members) define working age as 15 to 64 years.
High labour productivity offers the means to produce more from given inputs of capital and labour. Labour productivity growth (assuming no improvement in the 'quality' of labour, such as from better training) can arise from one or both of two components: more capital per worker - capital deepening; or combining capital and labour more efficiently through better work practices, better management, or better allocation of resources across industries - multi-factor productivity. Measuring and analysing precisely how the components of labour productivity rise, however, is an inexact science. The interaction of population demographics, participation factors and productivity generates Gross Domestic Product, the national accounts valuation of all goods and services produced in an economy. GDP per person is often used as an approximate indicator of the standard of living in a society. Whilst the standard of living of individuals does vary on distributional grounds and while factors such as the state of the environment which are not measured by GDP affect standards of living, the measure of GDP per person does permit researchers to make comparisons across countries using widely available data measuring standardised concepts. Measurement issues are nevertheless important to this area of work. Differences in national statistical practices, or in whether variables are measured in national currencies or converted to a common currency (and if so, how) are therefore noted where relevant. |
Policy can have little impact on these outcomes. Most of the choices that will influence the make-up of the working age population in the next 40 years have already been made. Conceivable changes in the level of immigration relative to recent outcomes would have only marginal impacts on the overall population growth rate and age structure of the population. Even if the birth rate were to increase in the future, it would be at least 25-30 years before the proportion of the population in the traditional working age group would start to rise in response. In the meantime, labour force participation rates amongst young adults could actually decline in response to increased parenting responsibilities, while the number of dependents would rise (Henry 2002).
The various components of Participation (Chart 1) determine the extent to which the population is willing and able to work. Over recent years, these components had a net positive effect on economic growth. The overall labour force participation rate (the proportion of the working age population that chooses to enter the labour force and seek work) has risen gradually as more women have entered the labour force, more than offsetting a declining participation rate among men. The unemployment rate has fallen since the early 1990s, while the average number of hours worked per employee has fallen only slightly. As a result, participation (the hours worked per head of the working age population) has risen.
Given that the nature and extent of labour force participation is largely a matter of individual choice, the wellbeing of society as a whole is likely to be enhanced if people have maximum scope to make choices, taking into account their own circumstances and preferences. However, it needs to be recognised that such choices may impose costs on society and can be distorted by disincentives or obstacles to participation that may exist. Policy choices can affect these distortions and obstacles. These issues are discussed in greater detail later in this statement.
Productivity growth has been by far the major source of growth in GDP per capita. Australia's productivity growth in the 1990s was stronger than in most other OECD countries, particularly in the second half of the 1990s. Policy can also have a major influence on the productivity growth rate.
Taking these three factors together, Australia's level of per capita income has been around three-quarters of the US level for most of the past half century (Table 1). Between 1950 and 1990, the level of Australia's per capita income relative to the United States fell, although it still grew strongly in absolute terms. The main causes of the widening gap between Australia and the United States were a relatively poor productivity performance through the 1950s and 1960s, indeed, one of the worst in the OECD, and a relatively poor participation performance in the 1970s and 1980s.
Australia's impressive productivity performance since the beginning of the 1990s has only now restored our relative productivity and GDP per person to the position we held in the 1950s. By contrast, for 'large continental European countries, GDP per capita stopped converging to US levels in the 1980s. And probably backtracked in the 1990s. The same conclusions also apply for Japan'. (Cotis 2003, p. 1) The OECD believes this diversity of performance stems primarily from costly policy failures in some member countries.
Table 1: GDP per person, participation and productivity, 1950-2001
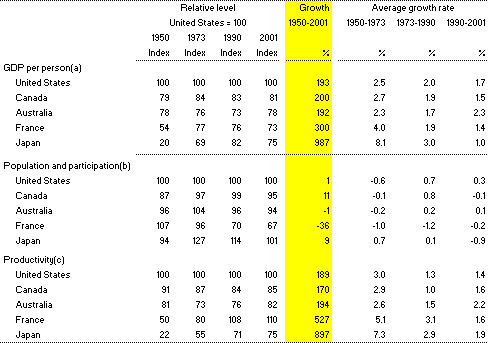
- Measured at 1999 US dollars, at purchasing power parities.
- Hours worked per capita.
- GDP per hour worked.
Source: University of Groningen and The Conference Board (2003).
More generally, over the past decade, OECD countries with high GDP per capita growth rates have typically had population, participation and productivity trends working together to enhance living standards. Countries with the slowest growth had productivity growth insufficient to offset relatively slow growth in the population of traditional working age and/or relatively low participation growth (OECD 2003e pp. 35-37 and Figure 1.2).
Future productivity and participation trends are likely to develop interactively. For example, if Australia achieved very high rates of productivity growth, there may be less need to increase participation to generate growth and people might choose to exercise some of their potential income gains by reducing working hours.