



High productivity: getting the most from participation
Productivity growth determines the growth in living standards in the long run. At any point in time, the level of productivity will determine the standard of living society can enjoy from chosen levels of participation.
The participation rate will never reach 100 per cent. However, higher productivity growth can deliver compound growth in income from whatever participation level is achieved, year after year. Even if the growth rate of productivity slows in the future (as it has in periods in the past), higher productivity levels achieved by then would mean higher incomes, higher savings, higher investment and higher future growth.
Over the last decade, Australia was one of only a few OECD countries to experience a rise in productivity growth. Recent Australian and US analysis, and new multi-country comparisons, have helped to identify the reasons for this strong performance. In short, strong competition drove new work practices and encouraged rapid uptake of business-transforming information and communication technologies in a macroeconomic environment that supported steady growth and strong investment.
Australian productivity levels still trail the world's best in many sectors, notwithstanding this recent high productivity growth. One cause is that distances among regional markets in Australia, and between Australia and global markets, are large, and Australia has a history of high levels of protection. Together these have led to industries duplicating plants around Australia and persisting in producing goods or services to which Australia was, globally, not well suited. These features also resulted in more limited competition within Australia than otherwise would have occurred. Even though Asian economic growth, falling transport costs and widespread economic reforms of recent decades have gradually weakened the significance of these constraints on Australian productivity, they are likely to remain a substantial challenge to our future productivity growth.
Whether Australia can sustain the strong productivity growth of the 1990s will depend on two factors: the extent to which Australian industry can move to the productivity frontier in those areas where it now lags; and on whether that productivity frontier itself continues to move outwards with technological progress.
A decade of strong growth in productivity and income
Australia experienced extraordinarily strong productivity growth through the 1990s. This led the OECD in its report Is There a New Economy? to group Australia with five other economies that experienced a sustained jump in the trend growth of GDP per capita, associated with fast productivity growth and a strong uptake of information and communication technologies (OECD 2000, pp. 3-5).4
By the second half of the 1990s, Australia's average annual labour productivity growth was more than double that recorded in the late 1980s and had risen to rates last seen in the 1960s. (Moreover, in the 1990s Australia's productivity growth exceeded the OECD average; whereas in the 1960s, productivity growth was high everywhere and Australia's growth was below the OECD average.)
Australia's productivity surge started earlier than the United States' and accelerated to a higher rate. Recent estimates indicate that increased investment in the use of information and communication technologies made an important contribution to productivity growth in Australia, slightly more so than in the United States. The real story for Australia, however, has been in the growth of the residual part of labour productivity growth, so-called 'multi-factor productivity growth'. This growth was far more rapid in Australia than in the United States and captures the increased output from better combining labour and capital inputs. This reflects factors such as improving management and work practices within industries, and resource reallocation into more productive industries (Table 3).
Table 3: Contributions to labour productivity accelerations - United States and Australia
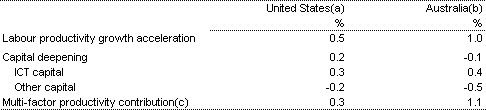
- Growth in the 1992 to 2000 cycle minus growth in the 1986 to 1992 cycle.
- Growth in the 1993-94 to 1999-2000 cycle minus growth in the 1988-89 to 1993-94 cycle.
- Multi-factor productivity growth for the United States includes the contribution to labour productivity growth from labour quality.
Note: Figures may not add to totals due
to rounding.
Source: Parham (2002).
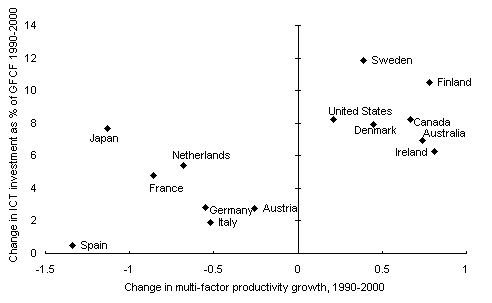
Recent analysis suggests that Australian economic reform has been central to much of the increase in multi-factor productivity growth. Reform encouraged both a more efficient allocation of labour and capital, and a competitive environment which drove workplace change within industries. These changes were conducive to the uptake of information and communication technologies, in both new and established plants. These technologies, in turn, contributed to the ongoing re-design of existing business processes (Parham 2002, p. 58). Australia was one of the leading economies in the OECD in using these technologies to achieve multi-factor productivity gains (Chart 6).
Chart 6: Pick-up in multi-factor productivity growth and increase in information and communication technology investment
Source: OECD (2003e) and OECD (2002a), as updated.
Can US productivity growth keep expanding potential productivity?
Since the United States defines many of the sectoral productivity frontiers, understanding its productivity experience is important to understanding Australia's. This offers special insights into whether Australia can hope to keep catching up to global productivity frontiers that are themselves moving outwards over time.
Productivity growth in the United States jumped from a trend growth rate of about 1½ per cent to around 2¼ per cent through the late 1990s. Estimates of how information and communication technology use has lifted productivity in the United States still differ, with some stressing capital deepening in these technologies and others the possibly greater contribution of multi-factor productivity growth. But all agree information and communication technology contributed significantly to the improved productivity performance (Kahn and Rich 2003; Gordon 2003; Oliner and Sichel 2002).
Fears that the collapse in information and communication technology asset prices would stall investment by US computer users, and thereby punctuate the contribution of information and communication technologies to productivity growth, were misplaced. In fact, investment in computers and software has picked up again after the US recession of 2000 and 2001, with anecdotes suggesting the rapid technological obsolescence of much investment of this type meant firms were soon driven to replace ageing computers and software installed during the Y2K episode and the dot.com boom.
Recent sectoral analysis shows that, outside the information and communication technology producing sector itself, most US productivity growth since the 1990s was in the retail, wholesale and financial services sectors - all intensive information and communication technology users (Gordon 2003). In the retail sector, productivity growth seems to have arisen from competition, with new, more productive market entrants displacing older established players. In such cases, it was not just the use of these technologies, but the ability to invest in new, better-designed facilities that permitted a whole range of reorganisation.
Reflecting on the increasing evidence that competitive pressures are central in raising productivity, the President of the US National Bureau of Economic Research, Martin Feldstein, commented that:
'... even if the technical changes in information technology had not occurred, the pressures to raise profits and reduce costs would have led to a greater increase in productivity in the United States [than in Europe]. Information technology was just the means, a very powerful means, for translating the pressure for profit enhancement through cost reduction into practice.' (Feldstein 2003, p. 8)
Sectoral productivity comparisons: the United States and the European Union
The higher United States productivity growth performance compared to the European Union's is almost all due to productivity growth in the retailing, wholesaling and financial sectors. More than half the difference arises in retailing alone.
While both US and European retail sectors had similar access to information and communication technology advances, the divergent productivity performance arose principally through the relative ease with which new firms could enter the market in the United States, and the application of new investment and new modes of business by all firms.
By contrast, Europe's relatively burdensome restrictions on closure of large businesses, zoning regulations restricting start-up of new businesses, general regulatory burdens and onerous employment protection legislation are impediments to business start-ups, productivity growth and the uptake of new technologies (Gust and Marquez 2002; Gordon 2003).
Feldstein has generalised these insights from the retail sector to comparisons of US and European management motivation and work practices:
'The US-Europe difference is not just a matter of incentives. The organizational rules and constraints are also very different on the two sides of the Atlantic Ocean. European work rules, embodied in union agreements and legislation, make it much more difficult to change work assignments or discharge redundant workers. And to the extent that is true, it acts as a barrier and a disincentive. Why introduce a new technology that permits managing with fewer employees when you cannot discharge those who become redundant? And even when changing work assignments can eventually be achieved, the effort to do so is so great that in many cases European managers are discouraged from even starting.' (Feldstein 2003, p. 8)
Why does Australia lag in productivity and income levels?
Achieving high productivity depends in part on specialisation of skills and achieving economies of scale and scope across the economy, including in service industries.5 While Australian productivity levels are now around the world's highest in industries such as transport, storage and communications, productivity levels more generally still trail the world's best (van Ark and Timmer 2002, pp. 103 and 107). This is notwithstanding particularly strong productivity growth in the 1990s in wholesaling, construction, finance, accommodation, cafes, restaurants, and retailing (Parham 2002).
Fully achieving economies of scale and scope in many industries requires large markets, either domestically or internationally through trade. Australia was a small domestic economy through the nineteenth century and much of the twentieth century, fragmented into even smaller regional economies. With the transport technologies of those days, regional Australian economies were at very costly distances both from each other and from the global economy, then centred on Western Europe and North America.
Australian policies from the 1930s exaggerated these natural disadvantages through high trade barriers. The effect of these barriers was to further reduce the force of international competition across a range of industries. From the 1970s, Australia also restricted international investment and entry of foreign firms into the domestic market, further reducing the potential for competition and improved productivity performance.
These structural policy failures were exacerbated by difficulties in managing the macroeconomy, particularly in the face of adverse external developments. Macroeconomic policy settings lacked clear frameworks to handle the instabilities of the 1970s and 1980s and contributed to the recession in 1990-1991. It was not until the mid 1990s that the Australian monetary policy framework was consolidated into a medium-term inflation-targeting regime. A Statement on the Conduct of Monetary Policy was agreed between the Treasurer and the Reserve Bank Governor in August 1996, which formalised the operational independence of the Reserve Bank in implementing monetary policy to achieve the Government's inflation goals. This Statement included a commitment by the Reserve Bank to hold inflation between 2 and 3 per cent on average, over the course of the economic cycle.
The Government announced legislation in 1996 to establish a new fiscal framework. The Charter of Budget Honesty Act 1998 states that fiscal policy should be directed at maintaining the ongoing economic prosperity and welfare of the people of Australia, and therefore should be set in a sustainable medium-term framework. The primary objective of the fiscal strategy is to maintain budget balance, on average, over the course of the economic cycle.
Fiscal policy and monetary policy were poorly coordinated prior to these developments, and generated considerable uncertainty. The exchange rate, before being floated in 1983, also transmitted adverse overseas developments (such as the oil price shocks) rather than providing a fully effective means to cushion the economy from their impact. With inflexible labour and product markets (and a centralised wage fixing system), the effects of these shocks were transmitted widely and rapidly into the broader economy. The result was a tendency towards higher inflation, lower growth, weaker investment, rising unemployment and poor productivity. Moving these macroeconomic policies onto a medium-term footing improved the climate for quality investment decisions and hence the potential for productivity growth.
The rapid economic growth of Asia over recent decades will help to ameliorate the disadvantage of long distances from Australia's international markets. Falling international transportation costs have also played a role by helping to lower the costs of Australia's trading with the rest of the world. Containerisation of shipping, widening use of bulk carriers, the growth of air freight and the fall in communication and data costs have all lowered costs of international trade.
Nevertheless, the costs of trading with major international markets remains a key barrier for Australia relative to other countries. For example, from the 1950s to the 1990s, the proportion of world GDP within a 10,000-kilometre circle from Sydney increased from some 16 per cent to 28 per cent. But for London, the same sized circle enclosed 94 per cent of world GDP in both the 1950s and the 1990s (Chart 7). By this measure, the only OECD country in the world more remote from the bulk of global GDP than Australia is New Zealand.
Distances among domestic markets continue to constitute an economic hurdle. Australia is the world's sixth largest country in area, yet has a relatively small population of around 20 million. No two cities in Australia with a population of over one million are closer than 600 kilometres, and Perth is 2,400 kilometres from its nearest Australian regional market. In contrast, California (which economic historians have noted was once very similar to the Australian economy in size and affluence), now has a population of around 34 million in an area around one-twentieth of Australia's, with its population concentrated between San Diego and Sacramento - a distance of some 800 kilometres (McLean and Taylor 2001).
Chart 7: Distance to the world's GDP from Australia and the United Kingdom
|
Australia(a)
|
United Kingdom(a)
|
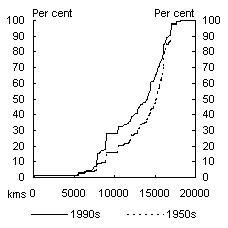
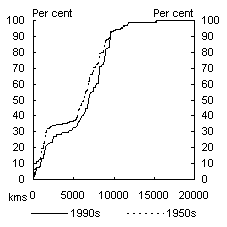
- These charts show the percentage of world GDP (measured in purchasing power parity terms) falling within circles of different radii (from 0 to 20,000 kilometres) from either Sydney or London.
Source: Treasury calculations based on data from Maddison (2001).
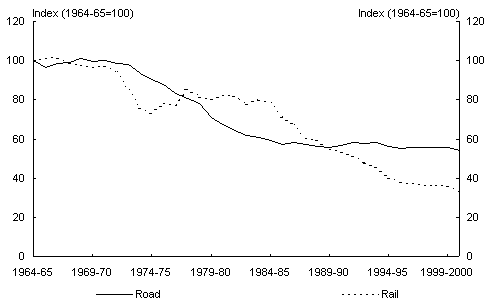
Technological change and economic reforms have made a difference domestically: the improvements in roads, the use of larger articulated trucks and reform of the railways have lowered the costs of national trade. Since 1965, road freight rates have almost halved in real terms while rail freight rates have fallen by two-thirds (Chart 8). Since 1990, real coastal shipping rates to and from Perth have fallen by 40 per cent and real air rates within Australia have fallen by 25 per cent.
Chart 8: Real road and rail transport costs, 1964-65 to 2000-01
Source: Bureau of Transport and Regional Economics (2002).
While neither international nor national distances among markets are as costly to Australia as they used to be, geographic remoteness is still a significant influence in the pursuit of world-class productivity performance and living standards.
Efficient resource allocation will lead to activities of the highest value being carried out. On the one hand, resources will be allocated to activities where distance is not a barrier or where Australia's advantages are clear. For example, in some areas of mining and agriculture, and potentially some areas of the international trade in services. On the other hand, it also means that, to a greater extent than for many other countries, resources will be allocated to activities where distance confers natural protection by decreasing the competitiveness of imported goods or services. As a consequence, Australia's relative levels of productivity may be behind global best practice in these areas.
These remaining economic costs of distance cannot be wholly erased, and constitute a challenge to the quality of all economic policies. Australia has to do better than other countries in the quality of policies to drive productivity if the remaining natural barriers of distance are to be overcome. For example, while Australia has relatively high productivity in the transport industry, still higher productivity may be needed to overcome Australia's geographical disadvantages.
Can Australian productivity keep rising at recent rates?
Continuing high Australian productivity growth will require an environment in which individual businesses strive for better products or better ways of doing things and where resources move quickly to the good ideas. Competition is central to this, through providing both an incentive for new ideas and effectively sorting the good from the bad. It has become clear that the level and acceleration of labour productivity growth in the 1990s in Australia came about through both the outward movement of the international productivity frontier and Australian convergence with that frontier. Looking forward, there continues to be scope for both of these factors to drive productivity growth.
In moving towards the productivity frontier, competition and flexibility in product and labour markets, supported by good education and training in a stable macroeconomic environment have been found to be centrally important. In general, Australia's policies have been found by the OECD to be relatively good. Nonetheless, strong productivity growth is not automatic: it will require consistent striving for competitive, flexible markets and continuing policy reforms.
For future outward moves in the productivity frontier, there are several grounds for optimism. First, there is evidence of momentum in the recent high United States productivity growth that would keep US labour productivity growth around 2 per cent per year and perhaps as high as 2¾ per cent per year for several more years (Oliner and Sichel 2002).
Second, and beyond the short-term momentum from current uses of computers, the family of information and communication technologies could offer considerable medium-term contributions to productivity growth for a decade or more to come, as they gradually facilitate further organisational change and new business practices. In this respect, they resemble earlier 'general purpose technologies'. As with steam in the 18th and 19th centuries and electricity in the 19th and early 20th centuries, information and communication technology is now clearly a general-purpose technology with wide potential for further organisational change in many industries and in household life. But as experience with those earlier technologies has shown, applications take several decades to disperse through the economy. The railway and steam-related shipping booms occurred decades after the first application of steam power in factories and mines, and in turn the electrification of previously steam-powered factories took decades while new factories were constructed and new production line and management techniques were refined (Commonwealth Treasury 2001; DeLong 2002, p. 25).
Third, further technological innovation is likely in a range of areas, and should lead to productivity enhancements where competition and flexibility drive the application of new technology.
4 The other five economies grouped with Australia were the United States, Denmark, Ireland, the Netherlands and Norway. The group's accelerated growth through the 1990s was remarkable because the OECD area's growth slowed overall. Moreover, the fastest-growing, 'new economies' were already richer than average, reversing the previous four decades' experience, when the fastest-growing economies had been poorer than average. The 'new economy' phenomenon reversed the tendency for living standards within the OECD to converge.
5 'Economies of scale' refer to the frequent tendency for per-unit costs to fall as the number of units produced rises. 'Economies of scope' is the corresponding tendency for production or sale of distinct items or services to become cheaper through sharing costs of infrastructure or management.