


Appendix
Aid flows
Table 2: Australia's ODA 1971-72 to 2003-04
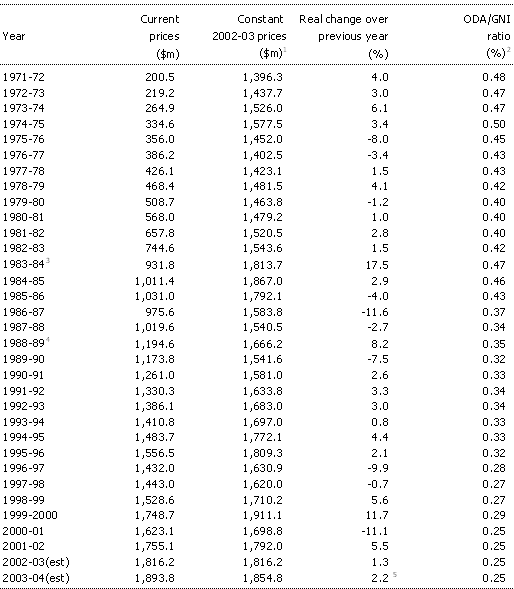
Diagram 14: DAC member countries' ODA/GNI ratios 2002
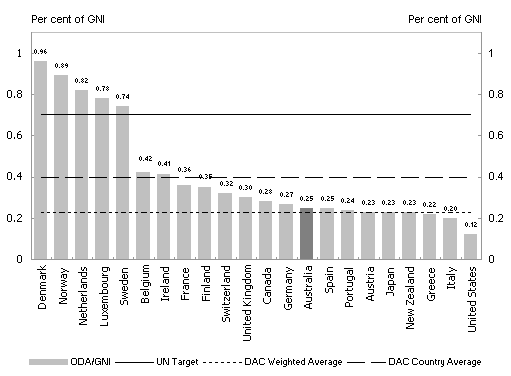
Source: DAC provisional figures for members' 2002 ODA
Diagram 15: DAC member countries' net ODA 2002
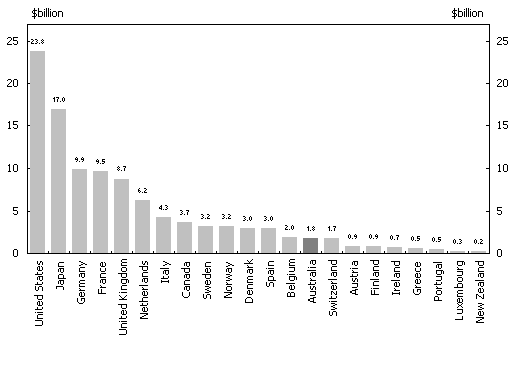
Source: DAC provisional figures for members 2002
Diagram 16: Total net resource flows to developing countries
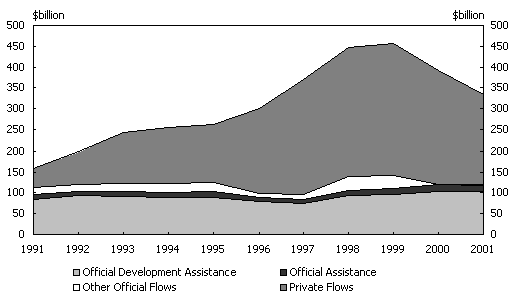
Source: DAC online databases
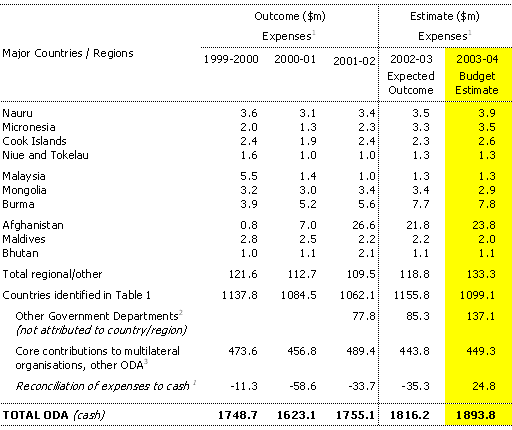
Table 3: Total Australian ODA flows to developing countries not detailed in Table 1
Aid program expenditure
Table 4: Country programs expenditure estimates and outcomes
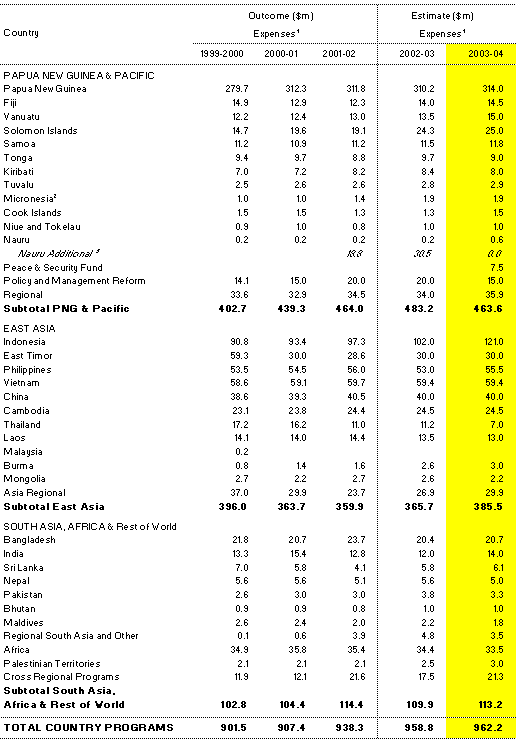
Table 5: Global programs expenditure estimates and outcomes
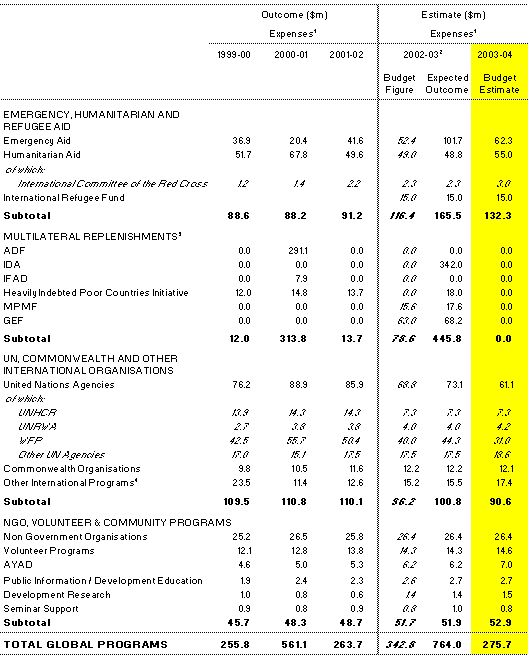
Table 6: Total ODA by subprograms
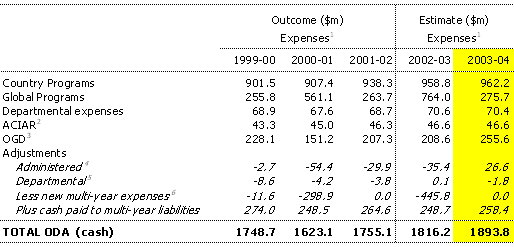
Table 7: Aid program expenditure through Australian and non-Australian NGOs
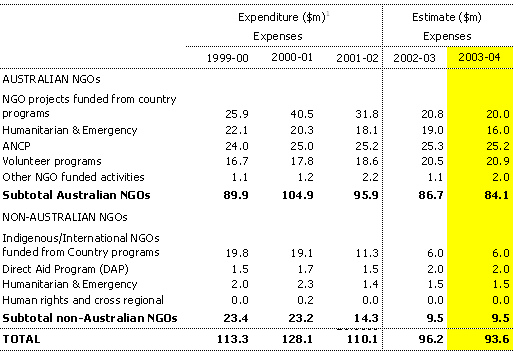
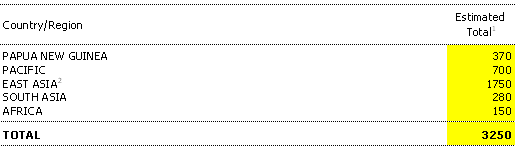
Table 8: Developing country students supported in 2003-04
Technical notes
General
- Normal rounding rules apply where the end digit is less than five. In accordance with the Department of Finance and Administration guidelines, where the end digit equals five, the numbers are rounded up to the next digit. Totals and percentages are calculated on unrounded totals. Columns may not add due to rounding.
- This budget paper details total ODA which includes expenditure by Other Government Departments (OGDs) that is classifiable as ODA as outlined by the Development Assistance Committee (DAC) of the OECD.
- Where real figures are presented the Non-Farm GDP deflator has been used.
- All estimates are exclusive of recoverable GST.
- All amounts are in Australian dollars (AUD) unless otherwise indicated.
- 'Current prices' express values in terms of the prices in the year of expenditure. 'Constant prices' express values adjusted for inflation in terms of a chosen year, which is the financial year 2002-03 in this publication. A 'real' increase or decrease refers to the change in figures adjusted for inflation (that is based on constant prices). A 'nominal' increase or decrease refers to the face value change between figures that have not been adjusted for inflation (that is based on current prices).
- Unless stated the source of data is AusAID.
Terminology
In 2001, the DAC officially converted from publishing ratios in terms of ODA/Gross National Product (GNP) to ODA/Gross National Income (GNI). In line with this conversion, all information published on the aid budget uses the concept of GNI.
Accrual Expenses and Cash
The Government moved to an accrual budgeting framework in 1999-2000 and subsequently, budget estimates, for example, Tables 4 and 5, are presented in terms of expenses. Multi-year liabilities, such as payments to the Asian Development Fund (ADF), IDA and IFAD are recorded as an expense at the time of signing the Instrument of Commitment, not when the cash is paid. This accounting treatment is used in AusAID's financial statements, available in the Foreign Affairs and Trade Portfolio Budget Statement on the Internet at http://www.dfat.gov.au/dept/budget.
Total ODA estimates (for example, Table 1) are adjusted from an expense by excluding the total expense commitment for new multi-year liabilities but including the cash paid to those commitments. Adjustments are also made for items such as movements in creditors and depreciation.
Estimates of sectoral expenditure are in cash terms throughout as they relate to total ODA which is reported in cash. A number of tables in this Budget statement include an 'adjustment' figure prior to calculating ODA. This figure includes adjustments for depreciation, investment, and expected net change in creditors. Table 6 also details the adjustments to multi-year liabilities, such as the multilateral development banks, to convert expenses to cash.
Apart from those individual estimates affected by multi-year liabilities, the difference between cash and expenses is minimal. The differences can be summarised as follows:
- The Pacific expense estimate is less than cash as the Nauru Settlement Treaty ($2.96 million in 2003-04) was recorded as an expense in 1993-94. In Table 1, the $2.96 million cash for the Nauru Settlement is included with the flows to Nauru to give a more comprehensive picture of Australia's estimated contribution in 2003-04.
- The Multilateral Replenishment expense estimates (see Table 5) are nil in 2003-04 as Australia does not expect to enter into any new multi-year contributions next financial year. Figures in Chapter 6 reflect the ongoing cash contributions Australia is making to these international institutions ($255.5 million), to give a more accurate picture of the flows to these organisations within the budget year. With the exception of Multilateral Replenishments all other global program expense estimates are equal to cash.
Methodology of AusAID estimates
Estimated Total ODA Flows
In estimating total ODA flows, AusAID begins with budget estimates for particular countries (specific country program estimates). To these are added estimates of expenditure from regional and global programs that do not have country allocations specified at the time of the budget. These estimates reflect previous expenditure patterns, and are subject to change throughout the year. Estimated total ODA flows (Table 1) also include ODA eligible expenditure by OGDs.
Estimated Sectoral Expenditure
While the key sectors of Governance, Education, Health, Rural Development and Infrastructure remain high priorities for the Australian aid program, centralised allocations are not made for expenditure in these sectors. Programming decisions are made on the basis of individual country strategies that are developed in consultation with partner governments, addressing their priority needs.
Expenditure in any particular sector is thus the result of programming decisions, made in accordance with Government policy but not determined at budget time. Estimates published in this Budget statement are qualified and are subject to programming decisions throughout the year.
Sectoral expenditure estimates reflect past trends in expenditure recorded in AusAID's Activity Management System (AMS) for 2001-02 and 2002-03. The AMS tracks actual and estimated expenditure on individual projects. Each project is allocated sector codes, in accordance with DAC guidelines, which reflect the primary focus of the project, as well as attributing secondary codes to track indirect expenditure. The 2002-03 estimated expenditure extracted from the AMS in February includes planned expenditure to the end of the year, which is adjusted to account for over-programming. To this is added estimates for sectoral flows from multilateral organisations, based on these organisations' reports. Further information relating to the value of imputed flows from multilateral organisations can be obtained from the Information and Research Services Unit, AusAID (ph 02 6206 4000).
Expenditure on the cross-cutting issues of environment and gender overlaps with expenditure on other sectors and should not be compared on the same basis. AusAID has revised its methodology for reporting on direct and indirect environmental expenditure. The methodology now incorporates aspects of expenditure related to water supply, fisheries and agriculture. Figures in the 2003-04 Aid Budget Statement are not comparable to those in previous years.
Notes to tables
Table 2
1 Based on Non-Farm GDP(E) Implicit Price Deflators provided by the Australian Bureau of Statistics, which have been rebased to 2000-01.
2 See Technical notes for an explanation of the change in terminology from GNP to GNI.
3 Australian Government contributions towards costs of educating private students from developing countries in Australian tertiary and secondary educational institutions were included in ODA for the first time in 1983-84.
4 In 1988-89 there was a one-off bringing forward of MDB payments, increasing 1988-89 but decreasing 1989-90 ODA expenditure.
5 This represents a real per cent increase over the 2002-03 budget figure of $1,814.6 million (at 2002-03 constant prices) as detailed in Table 1.
Table 3
1 See Technical notes for an explanation of the relationship between expenses and cash.
2 Other Government Department (OGD) not attributed to country/region includes ODA eligible expenditure by OGDs that has not been allocated to a specific geographic area.
3 Core contributions to multilateral organisations, other ODA expenditure includes, for example, expense payments which cannot be attributed to a particular country such as payments to some UN and Commonwealth organisations, and Departmental expenditure. The ODA eligible components of cash payments to IDA, ADF, IFAD, GEF, HIPC and the MPMF are included in this line item.
Table 4
1 See Technical notes for an explanation of the relationship between expenses and cash.
2 For the purposes of this table, Micronesia includes the Federated States of Micronesia, Palau and the Republic of the Marshall Islands.
3 Nauru Additional represents additional funding appropriated under Additional Estimates for 2001-02 ($18.8 million), and a New Budget Measure ($6.8 million) plus Additional Estimate funding in 2002-03 ($23.7 million).
Table 5
1 See Technical notes for an explanation of the relationship between expenses and cash.
2 Total flow estimates for 2002-03 represents budget figures as estimated at May 2002 and Expected Outcomes as estimated at May 2003.
3 New commitments to the MDBs, MPMF and GEF are recorded as expenses at the time of commitment. See Chapter Six for details of 2003-04 cash contributions to these organisations.
4 Other international programs include the ITTO and international health programs, the Global Conservation Trust. See Chapter Seven for details of 2003-04 contributions to these organisations.
Table 6
1 See Technical notes for an explanation of the relationship between expenses and cash.
2 ACIAR figures equal their total cash expenditure per year. ACIAR's full financial statements are available in the Foreign Affairs and Trade Portfolio Budget Statement at http://www.dfat.gov.au/dept/budget.
3 OGD includes ODA eligible activities by State Governments and Commonwealth Agencies other than AusAID and ACIAR. Included, for example, are capital contributions to Multilateral Development Banks, funded by Treasury appropriations, or Department of Health and Ageing contributions to the WHO.
4 Includes accrual adjustments and adjustments for non-ODA eligible Administered expenditure such as miscellaneous receipts, GST payments and other non-ODA eligible expenditure. Includes a one-off adjustment of $38 million between 2002-03 and 2003-04 relating to humanitarian aid to Iraq. AusAID received revenue of $38 million from the Official Public Account in 2002-03, for which an appropriation was booked, and will be appropriated cash through an administered capital injection in 2003-04.
5 Includes accrual adjustments and adjustments for non-ODA eligible Departmental expenditure such as receipts under section 31 of the Financial Management and Accountability Act, interest earned on bank deposits, GST payments and Fringe Benefits Tax.
6 Refer to the explanation of multi-year liabilities in the Technical notes.
Table 8
1 These numbers include participants in both the ADS and ARDS scholarships programs.
2 Includes partially aid funded East Timorese students who have been offered 'free' places by universities in Australia. Australia is providing funding through the Department of Education, Science and Training to assist with living allowances for these students.