




General government expenses
Reconciliation of expenses since the 2003-04 Budget
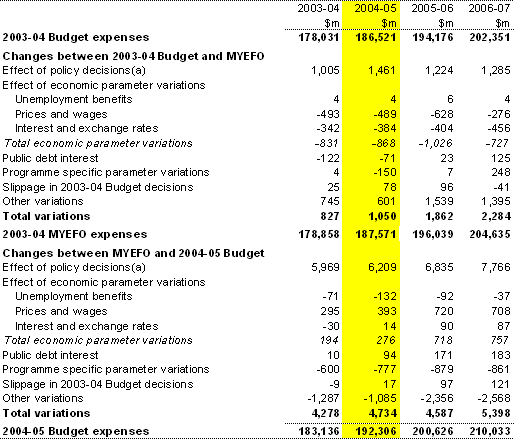
Table 2 provides a reconciliation of expense estimates between the 2003-04 Budget, Mid-Year Economic and Fiscal Outlook 2003-04 (MYEFO) and the 2004-05 Budget, showing the effect of policy decisions and economic parameter and other variations.
Table 2: Reconciliation of expense estimates
- Excluding the public debt net interest effect of policy measures.
Discussion of the changes between 2003-04 MYEFO and the 2004-05 Budget, shown in the above table can be found in Statement 2 (in the section titled ‘Variations in expense estimates’). Further information on expense measures can be found in Budget Paper No. 2, Budget Measures 2004-05.
Expense estimates by function
Table 3 sets out the estimates of Australian Government general government expenses by function for the period 2003-04 to 2007-08.
Table 3: Estimates of expenses by function
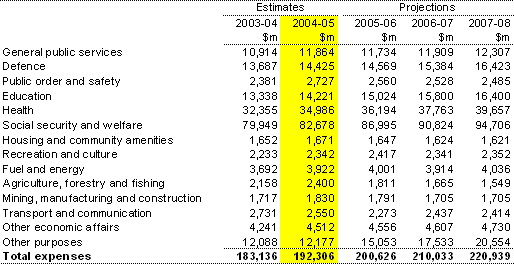
Major movements within the estimates of expenses by function between 2003-04 and 2004-05, and across the forward estimates, include increases in the following functions:
- Defence due to funding increases flowing from the Government’s White Paper Defence 2000 — Our Future Defence Force and additional funding being provided in this and previous Budgets for logistics, Defence facilities, military personnel costs and personnel initiatives;
- Education due to the impact of indexation arrangements and the announcement of a range of recent policy decisions including increases in funding for higher education, science and innovation and schools;
- Health due to a steady increase in the use of medical and pharmaceutical services over the forward estimates period, increasing costs for the provision of medical services and a continuing trend towards newer and more expensive drugs under the Pharmaceutical Benefits Scheme; and
- Social Security and Welfare due to the new package of assistance for families — More help for families, the on-going effect of indexation of payments, as well as demographic and social factors which affect demand-driven programmes.
Estimates presented in Table 3 above are more fully explained for each individual function in the following pages. Consistent with the short to medium-term focus of Statement 6, analytical commentary focuses on year-on-year changes across the forward estimates.
General public services
Table 4: Summary of expenses
- Debt redemption assistance expenses, paid by the Australian Office of Financial Management to the states and territories under the Financial Agreement Act 1994, have been reclassified from the Financial and Fiscal Affairs Sub-function to the Debt Assistance Sub-function (Other Purposes Function).
Nature of expenses and major trends
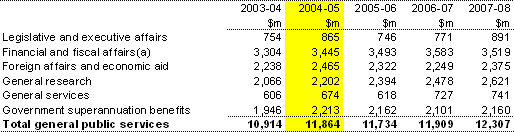
General public services include expenses on activities concerned with the organisation and operation of government. The function covers legislative and executive affairs, financial and fiscal affairs, foreign economic aid, general research, general services and government superannuation benefits (excluding nominal interest expenses on the unfunded liabilities of Australian Government superannuation schemes which are included under the Nominal Superannuation Interest Sub-function in the Other Purposes Function).
Expenses for the function tend to fluctuate over the budget and forward estimates period partly due to one-off factors such as the preparations for federal elections in 2004-05 and 2007-08 (Legislative and Executive Affairs Sub-function) and the 2006 Census (Financial and Fiscal Affairs Sub-function). General Research Sub-function expenses also grow over the forward estimates period reflecting the on-going impact of the Backing Australia’s Ability – An Innovation Plan for the Future package, announced in January 2001 and the Backing Australia’s Ability – Building Our Future Through Science and Innovation package. Increases in the Foreign Affairs and Economic Aid Sub-Function in 2004-05 and 2007-08 are driven by increases in Australia’s contributions to multilateral development banks.
Defence
Table 5: Summary of expenses

Nature of expenses and major trends
Expenses in this function are within the Defence portfolio and support operations and the delivery of navy, army, air and intelligence capabilities and strategic policy in the defence of Australia and its national interests.
Total annual expenses for the Defence Function rise by $2 billion over the period 2004-05 to 2007-08. In real terms, the growth in expenses for this function is 2.4 per cent a year on average.
The growth and pattern of expenses is due to a number of factors. Firstly, there is the influence of significant funding increases for investments in capability announced by the Government in Defence 2000 — Our Future Defence Force (the 2000 White Paper). Secondly, there are variations in funding levels for major Australian Defence Force deployments.
The remaining growth in expenses is largely due to additional funding being provided in this and previous budgets for logistics, military personnel costs and personnel initiatives along with Defence’s review and refinement of the accounting treatment of expenses and capital to reflect Defence’s long-term capital investment programmes. Defence’s expenses are partially offset by savings in 2004-05 from the reduction in the cost of equipment purchased overseas due to the appreciation of the Australian dollar.
Public order and safety
Table 6: Summary of expenses

Nature of expenses and major trends
Expenses for the Public Order and Safety Function support the administration of the Federal legal system and the provision of legal services, including legal aid, to the community. Public Order and Safety expenses also include law enforcement activities and the protection of Australian Government property.
Expenses for this function peak in 2004-05, reflecting various assistance initiatives in the Pacific. The growth in Other Public Order and Safety Sub-function expenses in 2004-05 reflects the impact of funding for the Regional Assistance Mission to Solomon Islands (RAMSI), and the introduction of the Australia-Papua New Guinea Enhanced Co-operation Programme to help Papua New Guinea address key challenges. Expenses decline from 2005-06 reflecting the fact that various domestic security initiatives and programmes, introduced after the 11 September 2001 and Bali attacks, will require less funding as they move beyond their establishment phase and the year-by-year consideration of RAMSI funding.
The growth in the Courts and Legal Services Sub-function includes measures to maintain equitable access to Commonwealth Legal Aid, establishment of a National Community Crime Prevention Programme, and a one-off increase in resourcing for workload increases in the Attorney-General’s Department.
Education
Table 7: Summary of expenses
Nature of expenses and major trends
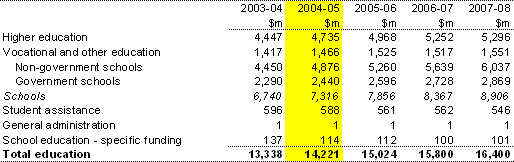
Education expenses support the delivery of education services through: higher education institutions; vocational education and training providers (including technical and further education institutions); and government (State and Territory) and non-government schools.
Expenses under the Student Assistance Sub-function include the ABSTUDY scheme, Assistance for Isolated Children and income support for students aged twenty-five years and over through AUSTUDY.
Total expenses for this function are estimated to increase by 8.9 per cent in real terms over the period from 2004-05 to 2007-08, or 2.9 per cent annually on average, with expenses on higher education and schools being the main drivers.
Growth in Higher Education expenses reflect the impact of higher education indexation arrangements and the announcement of policy decisions, including Our Universities — Backing Australia’s Future announced in the 2003-04 Budget.
Growth in expenses relating to schools is driven by a combination of indexation and the effect of announced policy decisions. Both government and non-government school funding increases according to agreed indexation parameters, incorporated in legislation, which are linked to movements in the Average Government School Recurrent Cost Index. The integration of Catholic systemic schools in the socio-economic status funding model will increase expenses by $356.2 million over four years and a range of measures in this Budget will increase expenses by $160.3 million over four years.
The Student Assistance Sub-function is expected to decline across the forward estimates because of the closure of the Student Financial Supplement Scheme to new borrowers.
Health
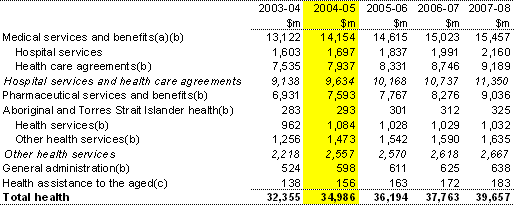
Table 8: Summary of expenses
- The financial impact of premium growth on the forward estimates for the 30 per cent Private Health Insurance Rebate has been allocated to the Contingency Reserve.
- The Department of Health and Ageing and the Health Insurance Commission have revised the split of their departmental resourcing across sub-functions and this significantly reduces their impact on the General Administration Sub-function and increases their impact on other health sub-functions.
- The bulk of Department of Health and Ageing and Department of Veterans’ Affairs expenses for assistance to the aged are now classified to the Assistance to the Aged Sub-function (Social Security and Welfare Function).
Nature of expenses and major trends
The Health Function includes expenses relating to: medical services funded through Medicare and the Private Health Insurance Rebate (Medical Services and Benefits Sub-function); provision of in-hospital services to eligible veterans and their dependants (Hospital Services Sub-function); funding under Australian Health Care Agreements between the Australian Government and the States and Territories (Health Care Agreements Sub-function); and the Pharmaceutical Benefits and Repatriation Pharmaceutical Benefits Schemes (Pharmaceutical Services and Benefits Sub-function).
Expenses related to health are likely to be a major, if not the major, contributor to increased Australian Government spending in the future. Total Government health spending is currently around 4 per cent of GDP.
Health Function expenses are expected to grow on average by around 2.3 per cent per annum in real terms over the budget and forward years. This growth is most pronounced in the areas of medical services and benefits, hospital services and pharmaceutical services and benefits.
Growth in the Medical Services and Benefits Sub-function is largely explained by the increasing costs of medical services, increasing per capita utilisation of medical services, general population growth and the impact of the Government’s MedicarePlus package.
The trend in the estimates for the Health Care Agreements Sub-function is driven by 3.0 per cent average annual growth, in real terms, in funding for the Australian Health Care Agreements over the life of the new agreements which cover the period 1 July 2003 to 30 June 2008.
Growth in Hospital Services Sub-function expenses is due to an ageing and increasingly frail veteran community requiring more hospital services.
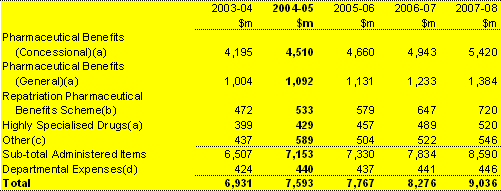
Expenses for the Pharmaceutical Services and Benefits Sub-function are forecast to grow at an average of around 4.0 per cent per annum in real terms, driven by a combination of an ageing population and demand for newer and more expensive drugs (see Box 6.1 below).
Box 6.1: Pharmaceutical Services and Benefits Table 8.1: Trends in major components of the Pharmaceutical Services and Benefits Sub-function
|
Social security and welfare
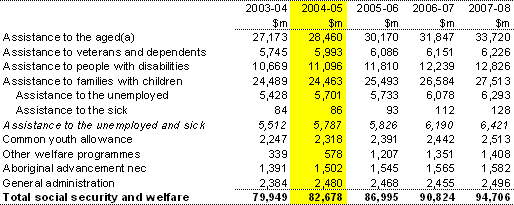
Table 9: Summary of expenses
- The bulk of Department of Health and Ageing and Department of Veterans’ Affairs expenses for assistance to the aged are classified to this sub-function.
Nature of expenses and major trends
The Social Security and Welfare Function includes pensions and services to the aged, services to the unemployed, assistance to people with disabilities, a variety of assistance to families with children, income support and compensation for veterans and their dependants, and advancement programmes for reconciliation and more generally for Aboriginal and Torres Strait Islander people.
Social Security and Welfare Function expenses are estimated to total around $82.7 billion in 2004-05 and grow significantly over the forward years. There has been a substantial base increase in the Assistance to Families with Children Sub-function in 2003-04, 2004-05 and the forward years due to the new package of assistance to families – More help for families. This package includes large increases in Family Tax Benefit Part A assistance, relaxing the income tests for both Family Tax Benefit Part (A) and Family Tax Benefit Part (B), and a new lump sum Maternity Payment.
The sub-functions contributing to the growth in the forward years are the Assistance to the Aged, Assistance to Families with Children and Assistance to People with Disabilities Sub-functions. The main driver for growth in these sub-functions is the indexation of payments, including maintaining the single rate of age and disability pensions at a minimum of 25 per cent of Male Total Average Weekly Earnings (MTAWE). In addition, demographic and social factors, including the ageing of the population, contribute to growth in the forward year estimates.
Growth across the forward years in the Assistance to the Aged Sub-function is largely due to indexation of the Age Pension, the major component of expenses, by MTAWE. A secondary factor impacting on expenses relating to assistance for the aged is the additional funding for the Investing in Australia’s Aged Care: More Places, Better Care package.
Growth in the Assistance to Families with Children Sub-function is due to the More help for families package and the indexation of the Family Tax Benefit (FTB) Parts A and B, Parenting Payments (partnered and single) and Child Care Benefit.
Similarly, growth in expenses in the Assistance to People with Disabilities Sub-function is driven largely by indexation of major payments including the Disability Support Pension, the Carer Payment, Carer Allowances, and the Commonwealth State Territory Disability Agreement.
Housing and community amenities
Table 10: Summary of expenses

Nature of expenses and major trends
The Housing and Community Amenities Function includes the Australian Government’s contribution to the Commonwealth State Housing Agreement, expenses of the Defence Housing Authority and various regional development and environment protection programmes.
Expenses under the Housing and Community Amenities Function increase in 2004-05 but decrease over the forward years reflecting reductions in expenses in the Urban and Regional Development Sub-function.
This, in turn, reflects the conclusion of funding currently provided for several regional development programmes including the Rural Transaction Centres Programme, the Small Business Interest Rate Relief programmes and the pilot Sustainable Regions Programme.
Expenses for the Environment Protection Sub-function remain relatively stable across 2004-05 to 2007-08 with the Natural Heritage Trust being a major driver.
Other significant expenses on conservation and sustainable use and repair of Australia’s natural environment are included in the National Estates and Parks Sub-function (Recreation and Culture Function) and the Natural Resources Development Sub-function (Agriculture, Forestry and Fishing Function).
Recreation and culture
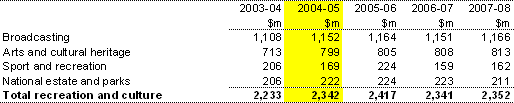
Table 11: Summary of expenses
Nature of expenses and major trends
Recreation and Culture Function expenses support: public broadcasting; the regulatory framework for Australia’s broadcasting sector; cultural institutions; funding for the arts and film industry; assistance to sport and recreation activities; and the management and protection of national parks and other world heritage areas. This function also includes expenses relating to the protection and preservation of historic sites and buildings, including war graves.
Total expenses for the Recreation and Culture Function are steady across the forward estimates period although there are some fluctuations within some sub-functions. The large increases in the Sport and Recreation Sub-function in 2003-04 and 2005-06 reflect the contribution provided to the Victorian Government to assist with the costs associated with staging the 2006 Melbourne Commonwealth Games.
The increase in Arts and Cultural Heritage Sub-function expenses relates to the Refundable Film Tax Offset which is part of the integrated Film Industry Package and provides a 12.5 per cent financial incentive for producers of high-budget films, with qualifying levels of Australian expenditure of at least $15 million per annum, to locate and produce their films in Australia. It also includes a new initiative aimed at strengthening the film and television production sector.
Other significant expenses on conservation and sustainable use and repair of Australia’s natural environment are included in the Environment Protection Sub-function (Housing and Community Amenities Function) and the Natural Resources Development Sub-function (Agriculture, Forestry and Fishing Function).
Fuel and energy
Table 12: Summary of expenses

Nature of expenses and major trends
This function includes expenses for the Energy Grants Credits Scheme (EGCS), Cleaner Fuels Grants Scheme and the Fuels Sales Grants Scheme, which are administered by the Australian Taxation Office. The EGCS was introduced on 1 July 2003 and replaced the Diesel Fuel Rebate Scheme and the Diesel and Alternative Fuels Grants Scheme. This function also includes expenses of the Australian Greenhouse Office for programmes funded under The New Tax System — Measures for a Better Environment Package and the Climate Change Strategy measures. Also included within this function are expenses for programmes relating to the production of alternative fuels including ethanol and biodiesel, that are administered by the Department of Industry, Tourism and Resources and the Australian Taxation Office respectively.
Expenses within this function are expected to increase relatively slowly from 2004-05 to 2007-08. The slow growth in this function and the decline in total expenses in 2006-07 reflect the cessation of the Fuel Sales Grants Scheme. However, significant growth in the EGCS and the impact of the Cleaner Fuels Grants Scheme, decided in the 2003-04 Budget, result in real growth in expenses in 2007-08.
Agriculture, forestry and fishing
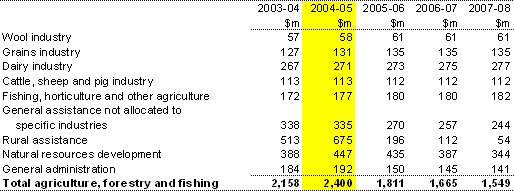
Table 13: Summary of expenses
Nature of expenses and major trends
Agriculture, Forestry and Fishing Function expenses support assistance to primary producers, forestry, fishing, land and water resources management, quarantine services and contributions to research and development.
Expenses decline over the forward years primarily due to progressively lower expenses within the Rural Assistance and General Assistance Sub-functions. The decline in the Rural Assistance Sub-function after 2004-05 reflects the expected return to normal seasonal conditions in Australia. The decline in the General Assistance Sub-function after 2004-05 reflects the stabilisation of quarantine border controls following a period of higher funding.
Other significant expenses on conservation and sustainable use and repair of Australia’s natural environment are included in the Environment Protection Sub-function (Housing and Community Amenities Function) and the National Estate and Parks Sub-function (Recreation and Culture Function).
Manufacturing and mining
Table 14: Summary of expenses

Nature of expenses and major trends
Expenses under this function relate to the manufacturing and export sectors, and are designed to improve the efficiency and competitiveness of Australian industries. Major expenses include programmes specific to the automotive, textile clothing and footwear (TCF) and pharmaceutical industries. Expenses also include Australian Government assistance to exporters through direct financial assistance for the development of export markets, information and promotional assistance, finance and insurance services, and the development of trade policy. There are also programmes providing research and development assistance grants and a programme of strategic investment incentives.
The increase in expenses in 2004-05 is mainly due to increases in research and development grants and specific strategic investment incentives. The decline in expenses from 2004-05 to 2005-06 is mainly due to a reduction in strategic investment incentives. The further decrease in 2006-07 is due to the renewal and redesign of the TCF programme to more strategically target beneficiaries.
Transport and communication
Table 15: Summary of expenses
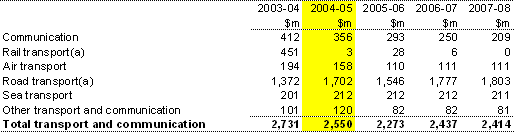
- Splits of additional AusLink funding between road and rail from 2005-06 onwards are yet to be determined.
Nature of expenses and major trends
Transport and Communication Function expenses support the infrastructure and regulatory framework for Australia’s transport and communications sectors.
Expenses fluctuate from 2003-04 to 2007-08 reflecting the irregular expenditure patterns associated with the commencement and/or completion of major programmes or one-off projects. The function includes expenses associated with the Government’s new land transport development plan, AusLink, which will involve expenditure on both road and rail for which detailed splits are yet to be determined.
The decline in the Communication Sub-function over the period to 2007-08 reflects the conclusion of programmes associated with several Australian Government initiatives that provided innovative telecommunications infrastructure and services in metropolitan, rural, regional and remote areas of Australia. These included initiatives associated with the sale of the 49.9 per cent of Telstra through two sales of shares in 1997 and 1999 (including the Networking the Nation Programme and the Untimed Local Calls Access Programme), the Telecommunications Service (Besley) Inquiry (including the National Communications Fund and the mobile phones programmes), and the Regional Telecommunications (Estens) Inquiry. The decline is, in part, offset by funding announced as part of the Backing Australia’s Ability — Building Our Future Through Science and Innovation package.
Rail Transport Sub-function expenses reflect the one-off payment made by the Government to the Australian Trail Track Corporation for new rail infrastructure projects on the interstate rail system in 2003-04. Rail Transport Sub-function expenses will increase from 2004-05 when rail projects to be funded under the new land transport development plan, AusLink are identified.
The Air Transport Sub-function in 2003-04 is higher than 2004-05 and forward years due to a one-off $35 million boost to regional airport security grants.
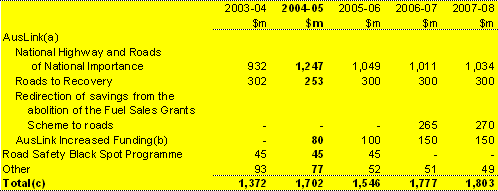
The impact of AusLink involves an increase in Road Transport expenses from 2004-05 to 2007-08. However, the level of Road Transport expenses in 2004-05 also reflects a one-off $200 million movement of funds from 2002-03 and 2003-04 for the National Highways Programme. AusLink will encompass the National Highways and Roads of National Importance programmes, a redirection of savings from the abolition of the Fuel Sales Grants Scheme to roads funding from 2006-07, increased Government funding of $630 million for the five years to 2008-09, and an extension of the Roads to Recovery Programme for a further four years from 2005-06 to 2008-09, which will provide assistance of $1.2 billion over that period to local councils for the construction, upgrade and maintenance of local roads.
The Government also provides untied funding to local government through Financial Assistance Grants that are identified for roads — see the General Purpose Inter-Government Transactions Sub-function (Other Purposes Function).
Major components of the Road Transport Sub-function are outlined in further detail in Box 6.2 below.
Box 6.2: Components of Road Transport Funding Table 15.1: Trends in major components of the Road Transport Sub-function
|
Other economic affairs
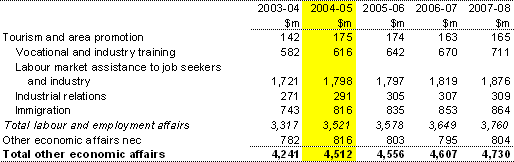
Table 16: Summary of expenses
Nature of expenses and major trends
The Other Economic Affairs Function includes expenses on tourism and area promotion, labour market assistance, immigration, industrial relations and other economic affairs not elsewhere classified (nec).
Expenses over the Budget and forward estimates are relatively stable.
Estimates for the Labour Market Assistance to Job Seekers and Industry Sub-function reflect increases in Job Network Programme funding.
Continuing growth in the Vocational and Industry Training Sub-function is due to an increase in apprenticeship/traineeship commencements.
Other purposes
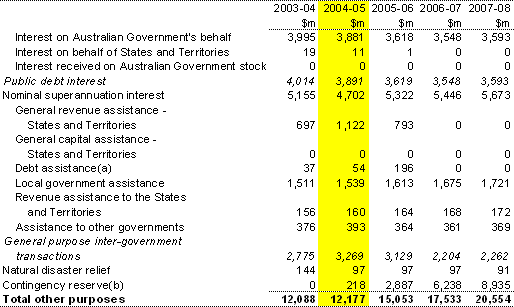
Table 17: Summary of expenses
- Debt redemption assistance expenses, paid by the Australian Office of Financial Management to the States and Territories under the Financial Agreement Act 1994, have been reclassified from the Financial and Fiscal Affairs Sub-function (General Public Services Function) to the Debt Assistance Sub-function.
- Asset Sale related expenses are now treated as a component of the Contingency Reserve.
Nature of expenses and major trends
The Other Purposes Function includes expenses incurred in the servicing of public debt interest, and assistance to the State and Territory governments and local government. The function also includes items classified to natural disaster relief, the Contingency Reserve, and costs of asset sales.
Excluding the Contingency Reserve and Nominal Superannuation Interest Sub-functions, the general trend is for a real decline in expenses over the forward years, mainly associated with reductions in Australian Government debt servicing costs — as a result of higher interest bearing debt being settled on maturity and replaced by lower interest bearing debt.
The fall in the General Purpose Inter-Government Transactions Sub-function from 2004-05 reflects trends in Budget Balancing Assistance (BBA) and other payments to the States. BBA payments are expected to cease from 2004-05 onwards as all States are expected to be better off as a result of tax reform in line with increases in GST revenue. However, the estimate for 2004-05 also reflects an Australian Government decision to compensate the States for a measure related to annual lodgement of the GST for some taxpayers.
The decline between 2003-04 and 2004-05 in the nominal superannuation interest expense for civilian superannuation reflects the pay-out of liabilities to the Telstra Superannuation Scheme and the Australia Post Superannuation Scheme. The increase in the nominal interest expense between 2004-05 and 2005-06 reflects the impact of Consumer Price Index movements on the nominal interest rate.
The increase in the Contingency Reserve from 2004-05 over the forward years is largely due to the conservative bias allowance — an allowance that compensates for the trend in expenses on existing Australian Government programmes to be underestimated by agencies in the forward years. The nature of the Contingency Reserve is discussed in more detail at Appendix B.
Continued next page...