



Appendix F: Historical Australian Government data
(continued)
Table F4: Australian Government general government sector net debt and net interest payments(a)
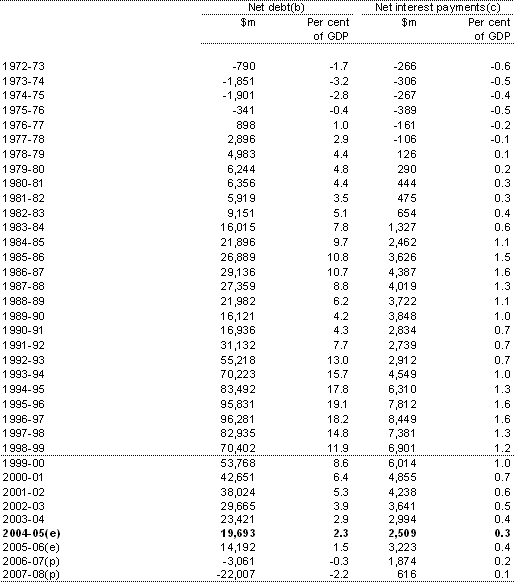
- There is a break in the net debt and net interest series between 1998-99 and 1999-2000 (the first year of accrual budgeting). Up to 1998-99, Australian Government general government debt instruments are valued at historic cost. From 1999-2000, Australian Government general government debt instruments are valued at market prices, consistent with accrual GFS standards.
- Source: ABS Cat. No. 5513.0, 5501.0, Australian Government Final Budget Outcomes and Treasury estimates.
- Excludes superannuation related interest flows.
Table F5: Australian Government general government sector revenue, expenses, net capital investment, fiscal balance and net worth(a)
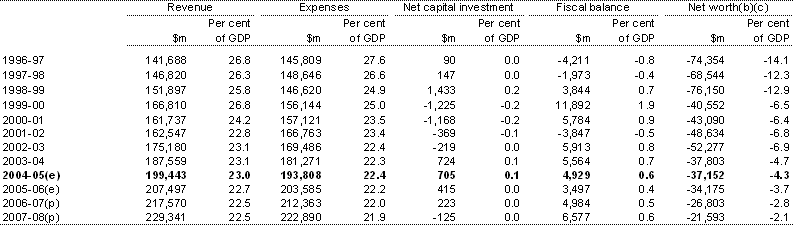
- The fiscal balance is equal to revenue less expenses less net capital investment. Net worth is calculated as assets minus liabilities.
- There is a break in the net worth series between 1998-99 and 1999-2000. Data up to 1998-99 are sourced from the Australian Government’s Consolidated Financial Statements based on Australian accounting standards. Data beginning in 1999-2000 are based on the GFS framework. For the general government sector, the major change across the break in the series is an improvement in net worth. This is primarily due to the move from valuing investments in public corporations at historic cost to current market value (which is calculated using the share price for listed corporations). This is partly offset by defence weapons platforms no longer being recorded as assets.
- From 2002-03, net worth also included the initial recognition of a provision for asbestos related claims. At the time of the 2002-03 Final Budget Outcome, a reliable actuarial measure was not available. Following an actuarial review, a provision for asbestos related claims was included in the audited 2002-03 Consolidated Financial Statements.
Table F6: Australian Government general government sector accrual taxation revenue, non-taxation revenue and total revenue
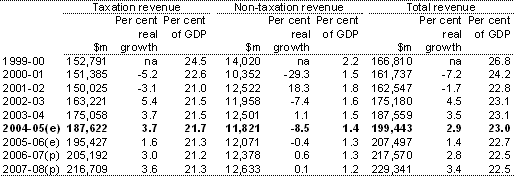
na Data not available.
Table F7: Australian Government revenue (accrual basis)
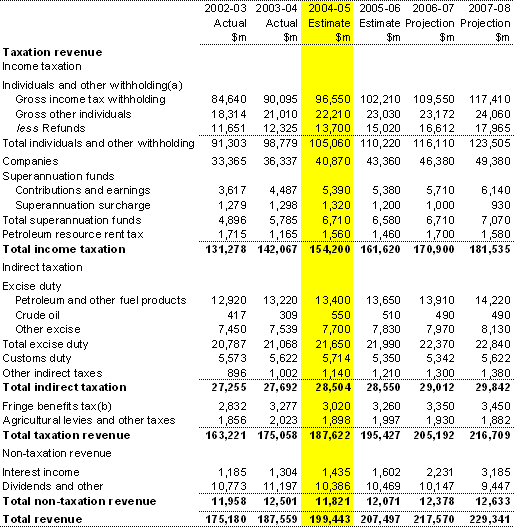
- Includes Medicare levy revenue ($5,000 million in 2002-03 and $5,560 million in 2003-04).
- Consistent with GFS reporting standards, excludes fringe benefits tax collected from Australian Government agencies ($323 million in 2002-03 and $365 million in 2003-04).
Table F8: Australian Government cash receipts, payments and cash surplus by institutional sector ($m)(a)
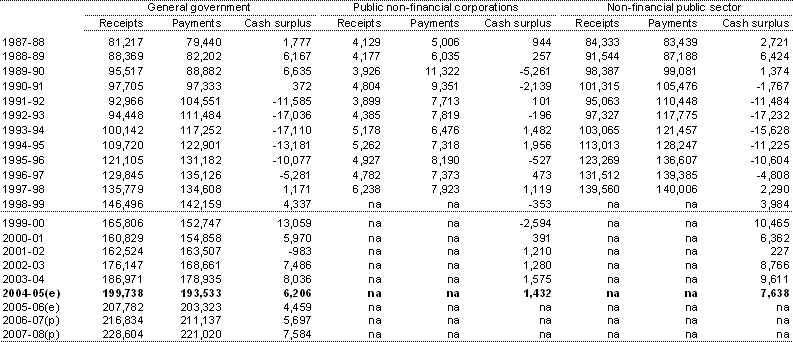
- There is a break in the series between 1998-99 and 1999-2000. Data for the years up to and including 1998-99 are consistent with the cash ABS GFS reporting requirements. From 1999-2000, data are derived from an accrual ABS GFS reporting framework, with receipts proxied by receipts from operating activities and sales of non-financial assets, and payments proxied by payments for operating activities, purchases of non-financial assets and net acquisition of assets under finance leases. Due to associated methodological and data-source changes, time series data that encompass measures derived under both cash and accrual accounting should be used with caution.
na Data not available.
Table F9: Australian Government accrual revenue, expenses and fiscal balance by institutional sector ($m)(a)
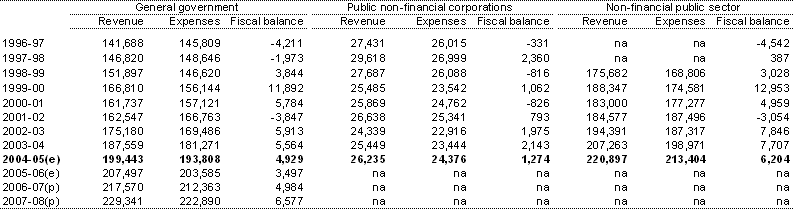
- The fiscal balance is equal to revenue less expenses less net capital investment. Net capital investment is not shown in this table.
na Data not available.