




Section 2: Outcomes and outputs information Outcomes, Outputs, Structures
Outcomes and output groups
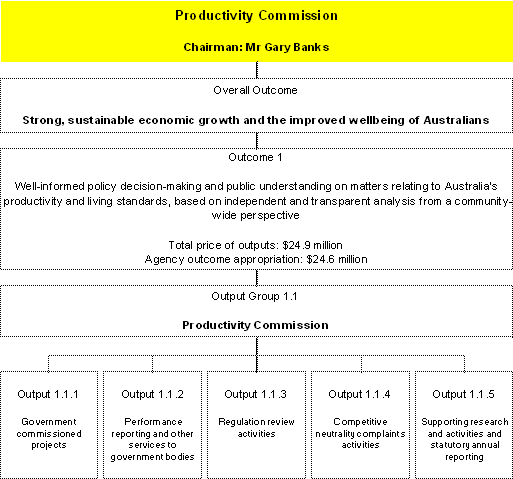
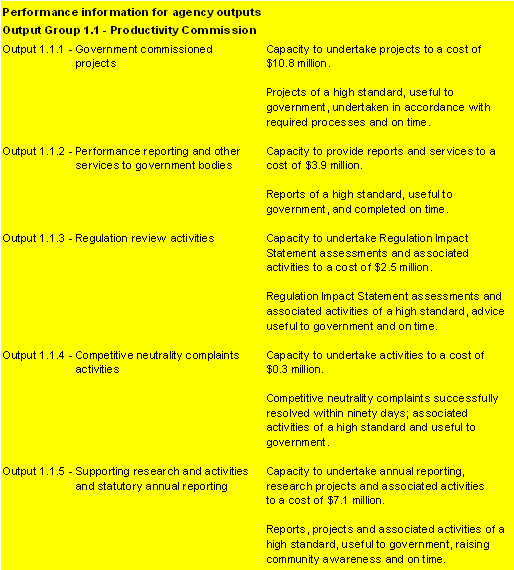
The map below shows the relationship between government outcomes and the contributing outputs for the Productivity Commission (the Commission). Financial detail for Outcome 1 by outputs appears in Table 2.1 while non-financial information for Outcome 1 appears in Table 2.2.
Map 2: Outcomes and output groups
Output cost attribution
Overheads and other indirect expenses that cannot be directly attributed to outputs are allocated to outputs in proportion to the direct costs (principally salaries) of the activities undertaken within each output.
Changes to outcomes and outputs
There are no proposed changes to the outcome or outputs
Outcome 1 — Description
Well-informed policy decision-making and public understanding on matters relating to Australia’s productivity and living standards, based on independent and transparent analysis from a community-wide perspective.
Measures affecting Outcome 1
There are no measures for the Commission in the 2004-05 Budget.
Outcome 1 — Resourcing
Table 2.1 shows how the 2004-05 appropriations translate to total resourcing for Outcome 1, including revenues from government (appropriations), revenue from other sources, and the total price of outputs.
Table 2.1: Total resources for Outcome 1
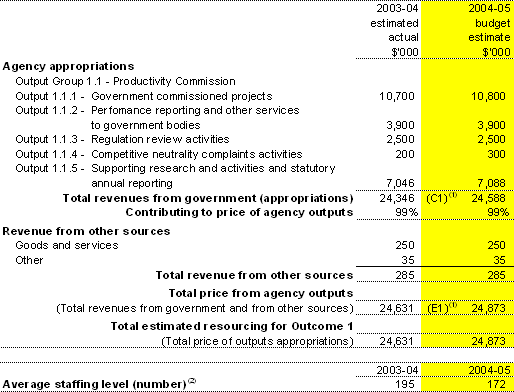
- C1 and E1 show the links back to Table 1.1.
- To deliver its mandated outputs in 2003-04, the Commission has maintained a staffing level of 195 thereby incurring an estimated loss of $1.5 million which is being funded by drawing down on its reserves achieved in previous years.
Outcome 1 — Contribution of outputs
The Commission’s five outputs derive from its statutory functions. The quantum and scope of the work under each output is largely determined externally (for example, government commissioned projects, regulation impact statement assessments, competitive neutrality complaints investigations). In view of this, the Commission requires the flexibility to vary resources amongst its various outputs.
The effectiveness with which the Commission’s outputs contribute to achievement of the outcome is difficult to assess. The Commission is but one source of policy advice on matters relating to Australia’s productivity and living standards and many issues are complex and long term. The Commission aims to demonstrate its effectiveness by reporting annually on the relevance, quality, timeliness and cost effectiveness of its outputs.
An elaboration of the activities covered by each of the outputs is as follows:
Output 1: Government commissioned projects
Public inquiries (for example, reviews of first home ownership, the Disability Discrimination Act 1992, the gas access regime and native vegetation regulation), case studies and other commissioned work (such as reform of building regulation and rules of origin under the Australia-New Zealand closer economic relations trade agreement).
Output 2: Performance reporting and other services to government bodies
Government services performance reports including Commonwealth/State/Territory Service provision, new work on key indicators of Indigenous disadvantage, performance monitoring and related research on government trading enterprises.
Output 3: Regulation review activities
Assessments of regulation impact statements, and a range of associated activities such as annual reporting, research, advice and education.
Output 4: Competitive neutrality complaints activities
Investigations of competitive neutrality complaints and associated activities such as research, advice and education.
Output 5: Supporting research and activities and statutory annual reporting
Statutory annual reporting; research and working papers in support of the Commission’s varying inquiry programme and to contribute to public policy issues; and associated activities such as submissions, conferences and speeches.
Performance information for Outcome 1
Table 2.2: Performance information for Outcome 1
Evaluations
Evaluation of actual levels of achievement will be shown in the Commission’s 2004-05 Annual Report. The framework for evaluation is described in the 2002-03 Annual Report, and will be updated in the 2004-05 Annual Report.