



Fiscal balance
As outlined in Figure 1 of Statement 8, the total public sector is made up of the total non-financial public sector (NFPS) and the total public financial corporations sector. The total NFPS is comprised of the general government sector and the public non‑financial corporations (PNFC) sector.
The general government sector forms the majority of the NFPS (particularly in terms of revenue and expenses). The PNFC sector tends to be more important at the state/local level, where most PNFCs are concentrated.
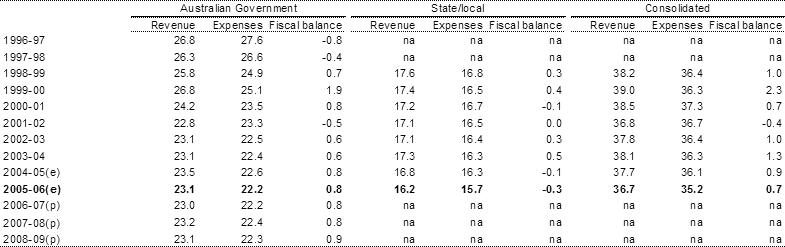
The fiscal balance of the Australian Government general government sector is expected to be a surplus of 0.8 per cent of Gross Domestic Product (GDP) in 2004‑05. The surplus is expected to be maintained at 0.8 per cent of GDP until 2008‑09, when the surplus is expected to rise to 0.9 per cent of GDP.
The fiscal balance of the state/local general government sector is expected to be a deficit of 0.1 per cent of GDP in 2004‑05. The deficit is projected to increase to 0.3 per cent of GDP in 2005‑06. This projection is predominantly based on state 2004‑05 mid‑year reviews, since only Victoria, the Australian Capital Territory and the Northern Territory have released their 2005‑06 Budgets.
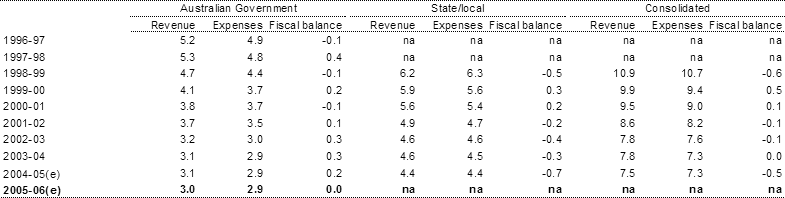
The consolidated2 PNFC fiscal balance is expected to be in deficit in 2004‑05 by 0.5 per cent of GDP. This includes an estimated Australian Government PNFC fiscal surplus of 0.2 per cent of GDP. The decrease in consolidated PNFC revenue and expenses as a share of GDP in recent years is partly attributable to the privatisation of PNFCs by both the Australian and state/local governments.
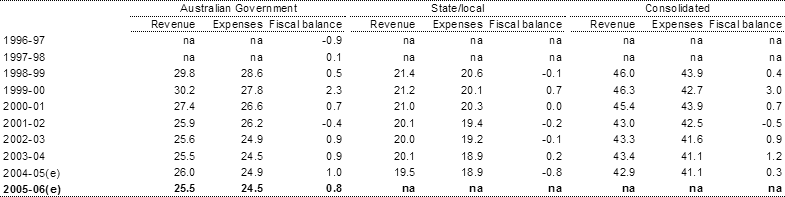
Tables 1, 2 and 3 show general government, PNFC and NFPS fiscal balance data by level of government respectively.
Table 1: General government fiscal balance by level of government (per cent of GDP)(a)
- The fiscal balance is equal to revenue less expenses less net capital investment. Net capital investment is not shown in this table.
e. Estimates.
p. Projections.
na Data not available.
Table 2: Public non‑financial corporations fiscal balance by level of government (per cent of GDP)(a)
- The fiscal balance is equal to revenue less expenses less net capital investment. Net capital investment is not shown in this table.
e. Estimates.
na Data not available.
Table 3: Total non-financial public sector fiscal balance by level of government (per cent of GDP)(a)
- The fiscal balance is equal to revenue less expenses less net capital investment. Net capital investment is not shown in this table.
e. Estimates.
na Data not available.
2 When combined, the Australian Government, state/local governments and universities are referred to as the ‘consolidated public sector’.