



Fiscal balance
As outlined in Figure 1 of Statement 8, the total public sector is made up of the non-financial public sector (NFPS) and the public financial corporations sector. The NFPS is comprised of the general government sector and the public non-financial corporations (PNFC) sector.
The general government sector forms the majority of the NFPS (particularly in terms of revenue and expenses). The PNFC sector tends to be more important at the State/local level, where most PNFCs are concentrated.
The fiscal balance of the Australian Government general government sector is expected to be a surplus of 1.2 per cent of Gross Domestic Product (GDP) in 2006-07 and 0.9 per cent of GDP in 2007-08. The surplus is projected to remain at around 1 per cent of GDP over the forward estimates.
After being in surplus in recent years, the State/local general government sector is expected to record a fiscal deficit of 0.5 per cent of GDP in 2006-07 and remain in deficit over the forward estimates. The forecast deficits reflect smaller operating surpluses and high levels of planned capital investment. Further detail on State general government sector operating and fiscal balances is contained in Budget Paper No. 3, Federal Financial Relations 2007-08.
The consolidated2 PNFC sector fiscal balance is expected to be in deficit by 1.1 per cent of GDP in 2006-07 and 2007-08. The increase in the PNFC deficit in recent years mainly reflects increased capital expenditure by PNFCs at the State/local level.
PNFC revenue and expenses have decreased significantly as a share of GDP since the 1990s. This is partly attributable to the privatisation of PNFCs by both the Australian and State/local governments. For example, Telstra no longer forms part of the PNFC sector following the further sell down of the Australian Government's interest in Telstra in 2006-07.
Fiscal deficits at the State/local level are also expected to result in the consolidated NFPS being in deficit in 2006-07 and 2007-08.
Tables 1, 2 and 3 show general government sector, PNFC and NFPS fiscal balance data by level of government.
Table 1: General government fiscal balance by level of government (per cent of GDP)(a)
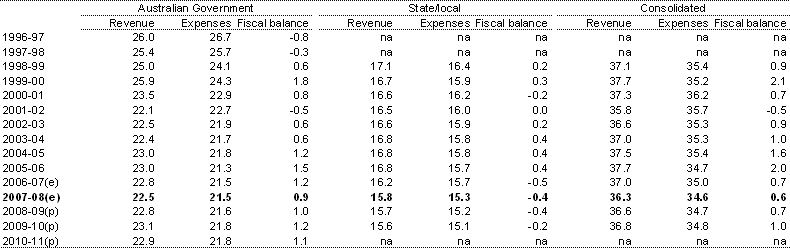
- The fiscal balance is equal to revenue less expenses less net capital investment. Net capital investment is not shown in this table.
- Estimates.
- Projections.
na Data not available.
Table 2: Public non-financial corporations fiscal balance by level of government (per cent of GDP)(a)
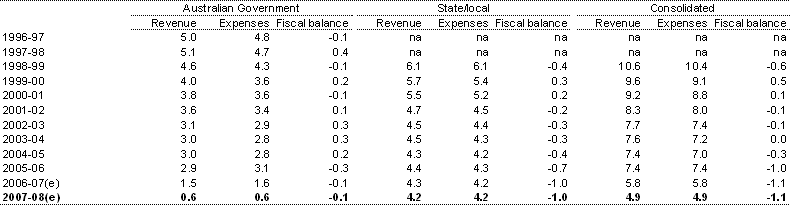
- The fiscal balance is equal to revenue less expenses less net capital investment. Net capital investment is not shown in this table.
- Estimates.
na Data not available.
Table 3: Non-financial public sector fiscal balance by level of government (per cent of GDP)(a)
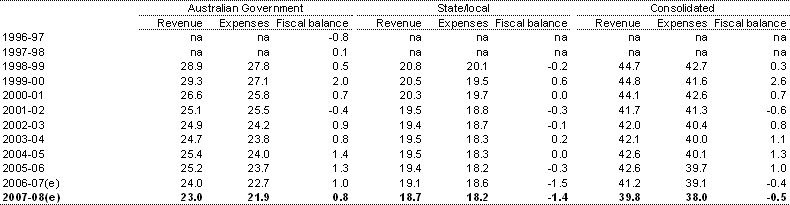
- The fiscal balance is equal to revenue less expenses less net capital investment. Net capital investment is not shown in this table.
- Estimates.
na Data not available.
2 When combined, the Australian Government, State/local governments and universities are referred to as the 'consolidated public sector'.