



Net debt
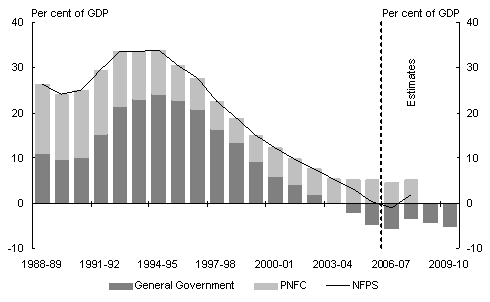
Chart 5 shows a consistent decline in consolidated general government sector net debt as a share of GDP from a peak of 24.2 per cent of GDP in 1994-95. The consolidated general government sector eliminated net debt in 2004-05 and its net debt levels are forecast to remain below zero over the forward estimates.
Charts 3 and 5 show the broad correlation between cash deficits and net debt levels. The financing of Australian Government cash deficits resulted in a substantial increase in general government sector net debt as a share of GDP over the early 1990s.
Chart 5 also shows the improvement in PNFC sector net debt as a share of GDP since the late 1980s, reflecting lower levels of capital expenditure, improved efficiency and privatisations. This moderated the deterioration in NFPS net debt as a share of GDP in the first half of the 1990s.
The improvement in NFPS net debt primarily reflects both the Australian Government and the State/local sector moving back into budget surpluses and the application of privatisation proceeds to debt retirement at both the Australian Government and State/local government levels.
PNFC privatisations during the 1990s occurred in two main sectors — electricity and gas (such as Victorian and South Australian electricity assets) and transport and communications (such as Telstra). Proceeds of asset sales have largely been used to reduce, or contain, the growth of general government net debt, resulting in ongoing savings in public debt interest.
Chart 5: Consolidated non-financial public sector net debt by sector
(as at end of financial year)(a)
- Data for the consolidated PNFC and NFPS are only available to 2007-08.
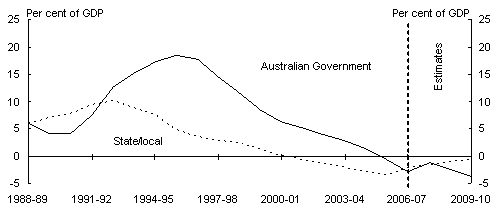
As shown in Panel A of Chart 6, Australian Government general government sector net debt as a share of GDP grew from low levels in the late 1980s to a peak of 18.5 per cent in 1995-96. Since then, successive surpluses and asset sales (most notably the sale of Telstra) have improved Australian Government general government sector net debt, with net debt being eliminated in 2005-06.3 Australian Government PNFC sector net debt is expected to be eliminated in 2006-07.
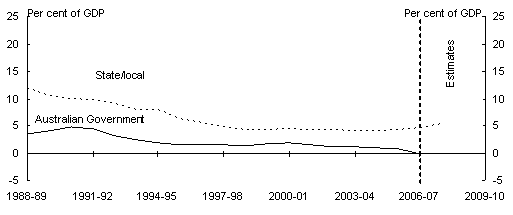
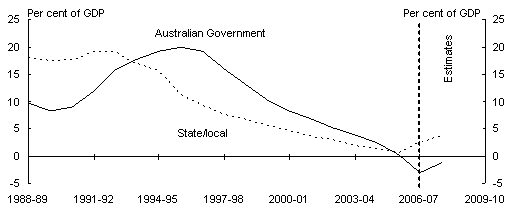
In contrast, State/local general government sector net debt grew more modestly in the early 1990s before declining from a peak of 10 per cent of GDP in 1992-93 to below zero from 2001-02 (Panel A of Chart 6). The State/local PNFC sector also experienced an improvement in net debt levels during the 1990s (Panel B of Chart 6). However, the States continue to hold significant net debt in the PNFC sector. State/local PNFC net debt is forecast to grow from 4.2 per cent of GDP in 2005-06 to 5.3 per cent of GDP in 2007-08. Total State/local NFPS net debt has also remained positive and is forecast to increase from 0.7 per cent of GDP in 2005-06 to 3.8 per cent of GDP in 2007-08 (Panel C of Chart 6). The States are forecasting further increases in net debt over the forward estimates as they borrow to fund their capital expenditure programmes. For further information, see Budget Paper No. 3, Federal Financial Relations 2007-08.
Chart 6: Net debt by sector and level of government (as at end of financial year)
A: General government sector |
|
B: Public non-financial corporations |
|
C: Non-financial public sector |
|
3 The forecast level of Australian Government net debt in 2007-08 is a result of an assumption that the Future Fund will increasingly be invested in equities, which are not included in the calculation of net debt.