Medium-term fiscal outlook
Importance of fiscal sustainability
The Government's economic and budget management over the past decade has delivered strong fiscal outcomes and supported economic growth. Delivering sustainable fiscal policy is a key requirement of good government. It avoids costly burdens being placed on future generations, as well as providing a secure and stable investment environment that encourages growth.
A sound fiscal policy framework involves maintaining government debt at sustainable levels, ensuring that government has the capacity to finance its continuing expenditure programmes and other budgetary obligations, and managing the Government's exposure to fiscal risks. The Government is continuing to address these issues through making necessary reforms today to avoid the need for larger adjustments in the future.
Fiscal outlook
The Government has achieved strong fiscal outcomes over recent years which have allowed it to eliminate net debt and establish the Future Fund. By eliminating net debt, the Government has put its finances in a sound position and has created a positive investment environment as investors and consumers have greater certainty about the stability of government finances. By setting aside resources in the Future Fund for the Australian Government's largest balance sheet liability — its superannuation obligation to its employees — the Government has ensured that these superannuation costs are not passed on to future generations.
The second Intergenerational Report released in April 2007 (IGR2) showed that the Government's long-term fiscal sustainability has improved since the first report in May 2002 (IGR1). In IGR2, the 'fiscal gap', or the amount by which spending is expected to exceed revenue, was projected to be around 3½ per cent of GDP by 2046-47. This compares to a projected fiscal gap in IGR1 of 5 per cent of GDP by 2041-42.
Although this is an improvement, demographic and other factors will continue to pose substantial challenges for economic growth and long-term fiscal sustainability. These factors will also present a challenge over the medium term.
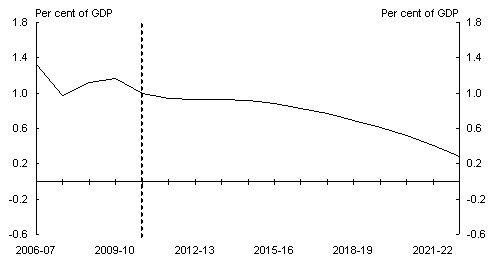
Chart 2 provides illustrative projections of fiscal pressures over the next 15 years, based on the IGR2 projections. As a base, the IGR2 projections were modelled using the forward estimates from the 2006-07 MYEFO updated for major announced spending measures up to the time of the release of IGR2. The medium-term projections in Chart 2 apply IGR2 growth rates for spending from the end of the current forward estimates period included in the 2007-08 Budget. Like IGR2, revenue is assumed to remain at a constant percentage of GDP from the end of the forward estimates period.
The medium-term fiscal projections in Chart 2 include net interest payments to be on a consistent basis with the underlying cash balance across the forward estimates period. This approach differs from IGR2 where, consistent with other international long-term budget reports, the fiscal projections were modelled using the primary balance which excludes net interest payments. Primary balance is used in such reports because debt dynamics can dominate and obscure the underlying fiscal pressures that need to be addressed. The long-term fiscal gap represents a policy choice that can potentially be avoided. In contrast, policy over the short to medium-term is more certain and financing therefore becomes more relevant.
The medium-term fiscal projections show that without policy change projected spending pressures identified in IGR2 are expected to erode much of the strong fiscal starting point over the next 15 years.
Chart 2: Fiscal projections over the medium term
Source: Treasury projections.
The spending pressures identified in IGR2 will see government spending increasing as a percentage of GDP from around 22 per cent currently to above 25 per cent in 2046-47 (Box 1).
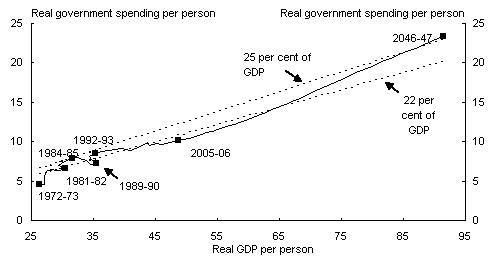
Box 1: Trends in Australian Government spending and economic growth Chart 3 is a scatter chart showing real government spending per person (excluding interest) against real GDP per person from 1972-73 through to the end of the IGR2 projection period of 2046-47. Both spending and GDP are deflated by the GDP deflator. The ratio of real government spending per person to real GDP per person is equal to the ratio of government spending to GDP. As Chart 3 shows, the historical ratio of government spending to GDP has been relatively stable, not exceeding 25 per cent. The ratio of spending to GDP tends to rise during periods of economic slowdown. This is due to both a slowing in GDP growth and an increase in real spending from automatic stabilisers and discretionary policy decisions. This is most notable in Chart 3 during both the early 1980s and the early 1990s slowdown. In the long-term, demographic and other factors highlighted in IGR2 will place pressure on government spending per person and slow the rate of growth of GDP per person, pushing the ratio of government spending to GDP above 25 per cent towards the end of the IGR2 projection period. Steps to manage these fiscal pressures will need to continue to address the growth in government spending and sustainably lift economic growth. The latter will be the key determinant of the Government's capacity to deal with future fiscal challenges over the medium term. Chart 3: Trends in Australian Government spending and economic growth(a)(b)
|