



Employment flexibility and security
Casual employment is an important feature of Australia's flexible labour market. In this section, the characteristics of casual employment are examined and the relationship between flexible labour markets and job security is discussed.
Characteristics of the casual employment market
The structure and operation of the Australian economy has changed markedly over the past two decades. These changes have produced more flexible working arrangements for the 'traditional' full-time permanent workforce. At the same time, changes in the structure of the economy have resulted in increased demand for non-traditional workers such as the young, students and females who, because of non-work commitments, tend to engage in the labour market on a part-time, non-permanent or casual basis.
Changes to traditional working arrangements have given firms more flexibility to allocate labour resources, resulting in improvements in productivity in the workplace. The growth in non traditional, part-time and casual employment opportunities has also resulted in increased labour force participation.
International comparisons show Australia has a very high rate of casual employment (OECD 2004a). Casual employment has been growing in many OECD countries and the average has crept up from 10 per cent in 1984 to around 12 per cent in 2004. Spain has the highest rate of casual employment in the OECD, followed closely by Australia.
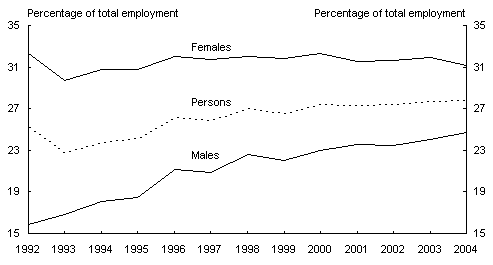
Chart 16: Casual employment as a proportion of total employment
Source: ABS cat. no. 6310.0. and Treasury calculations.
Casual employment has been growing steadily in Australia. In 2004, around 28 per cent of the workforce was employed on a casual basis, up from 23 per cent in the early 1990s (Chart 16). While the proportion of female casual employment has changed little, the growth in male casual employment as a proportion of total male employment increased from around 17 per cent in the early 1990s to around 25 per cent in 2004.
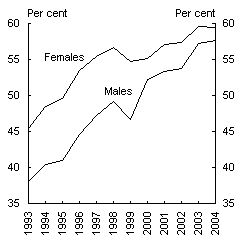
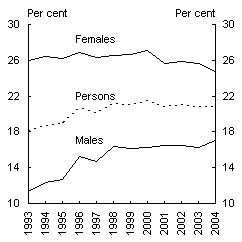
Age plays a significant role in determining the likelihood of being employed on a casual basis. Casual employment has, as mentioned previously, provided employment opportunities to a range of people whose non‑work commitments, including senior secondary and tertiary education, make it more difficult to engage in traditional employment arrangements. Young people (aged 15 to 24) in particular have benefited from these opportunities. Of those in employment, young people were almost three times more likely to be employed on a casual basis in 2004 than people 25 years and older (Chart 17). An interesting development is that the decline in older female casual employees has offset the rise in the young female casuals. For older males, casual employment grew sharply during the 1990s before levelling out somewhat since the late 1990s. This suggests that since that time, increases in male casual employment have been driven largely by younger males.
Chart 17: Casual employment as a proportion of total employment by age
(15-24 years) |
(25 and over) | |
|
|
Source: ABS cat. no. 6310.0. and Treasury calculations.
Casual employment may be a useful transition to more traditional forms of employment. The Productivity Commission (2006) found that casual employment may be a pre-cursor or 'stepping stone' to full time employment.
Job security
Concerns have been raised that the benefits of flexible labour markets come at the cost of job security. Growth of non-traditional forms of employment, such as casual employment, had been viewed as inferior to 'traditional' full-time, permanent employment arrangements. The evidence does not support this view. Employment duration has changed little over the past two decades and direct measures of job security are around record highs. The best approach to maintaining job security at high levels is to ensure that macroeconomic policy is aimed at maintaining a strong, flexible economy that keeps unemployment low.
A recent survey (ABS 2005), found that despite 50 per cent of casual employees having current employment durations less than 1 year, over three quarters expect to be in their current job in 12 months time. For all other employment types, around 95 per cent expect to remain with their current employers for the next 12 months. There is very little difference between men and women in each category. Despite changes in the survey methodology, perceptions of job security remain largely unchanged from the two previous surveys carried out in 2001 and 1998.
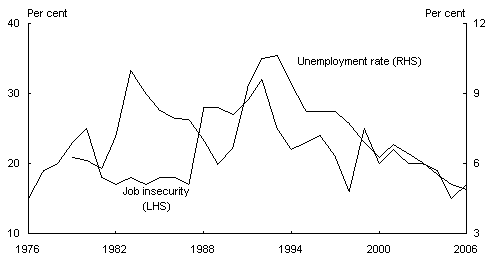
Chart 18: Employment security and the unemployment rate
Source: Morgan Job Security Poll and ABS cat. no. 6202.0.
The Morgan Poll (2007) has carried out an annual job security survey since 1975 making it the longest time series of job security perceptions available in Australia. The latest survey, carried out in December 2006, suggests that a record proportion of employees feel secure in their current jobs. Chart 18 shows that the perception of job insecurity, at least over the last 20 years, is related to the unemployment rate. As the unemployment rate falls, so does the proportion of people who feel insecure in their job.
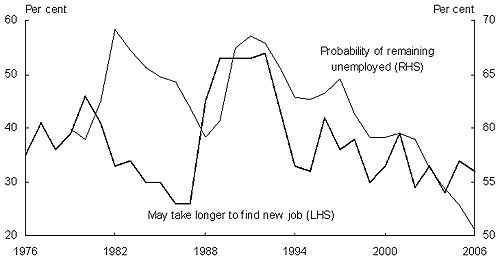
Chart 19: Testing job security perceptions
Source: Morgan Job Security Poll, ABS cat. no. 6291.0.55.001 and Treasury calculations.
Another question in the same Morgan Poll series is 'if you became unemployed, would you be able to find another job fairly quickly?' People's perceptions may not be correct because employed people do not necessarily know what conditions are like for the unemployed. Chart 19 shows the Morgan Poll series against ABS data that shows the probability of remaining unemployed from month to month and suggests that respondents over the last 20 years have relatively accurate perceptions of conditions they will face if they find themselves unemployed. Based on this series it appears that as the probability of remaining unemployed falls so does the proportion of respondents who think it will take longer to gain employment.