



Statement 9: Government Finance Statistics Statements
Financial tables presented in this statement are prepared in accordance with the Australian Bureau of Statistics’ (ABS) accrual Government Finance Statistics (GFS) framework.
The tables include an operating statement, balance sheet and cash flow statement for the Australian Government general government, public non-financial corporations and total non-financial public sectors. A statement of other economic flows is also included for the Australian Government general government sector.
The Australian, State and Territory governments have an agreed framework — the Accrual Uniform Presentation Framework — for the presentation of government financial information on a basis consistent with the ABS GFS publication. This statement presents Australian Government data on an ABS GFS basis, as required by the Accrual Uniform Presentation Framework, except for the departures (other than in relation to the treatment of goods and services tax (GST)) detailed in Appendix A to Statement 2.
The only difference between the Australian Government general government sector statements in Statement 2 and this statement is the treatment of the GST. The clear policy intent of the Intergovernmental Agreement on the Reform of Commonwealth-State Financial Relations is that GST is collected by the Australian Taxation Office, as an agent for the States and Territories (the States), and appropriated to the States. Consequently, it is not shown as Australian Government revenue in other parts of this document. However, the tables in this statement show GST as taxation revenue and payments to the States as grant expenses.
As a result of the different treatments of GST related transactions, fiscal balance, net operating balance and net worth estimates in this statement differ from those reported elsewhere in this document. This difference represents the effect of GST revenue accrued but not yet received and, therefore, not yet paid or payable to the States (as GST obligations to the States are on a cash basis).1 The cash flows presented in this statement include GST (except in respect to GST flows internal to the general government sector), whereas the cash flows presented elsewhere in this document do not. The GFS cash surplus/deficit is not affected and provides identical results under both treatments of GST receipts.
Transactions between the Australian Government general government and public non-financial corporations sectors are included in the relevant tables, but removed from the total non-financial public sector tables as they are transactions internal to that sector.
Computer software and other intangibles are recorded at historic costs, as an active market is not observable for such assets. This affects the public non-financial corporations sector balance sheet, but does not affect the general government sector balance sheet.
Statement 8 provides reconciliations between key GFS aggregates and their Australian Accounting Standards counterparts.
In accordance with Accrual Uniform Presentation Framework requirements, this statement also contains an update of the Australian Government’s Loan Council Allocation.
Government finance statistics statements
Table 1: Australian Government general government sector operating statement
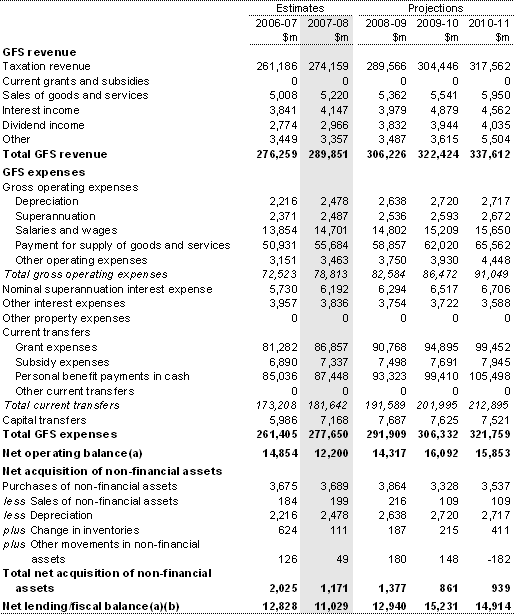
- The fiscal balance and net operating balance estimates in this table differ from those presented elsewhere in the budget reflecting the treatment of the GST as an Australian Government tax.
- The term fiscal balance is not used by the ABS.
Table 2: Australian Government general government sector balance sheet
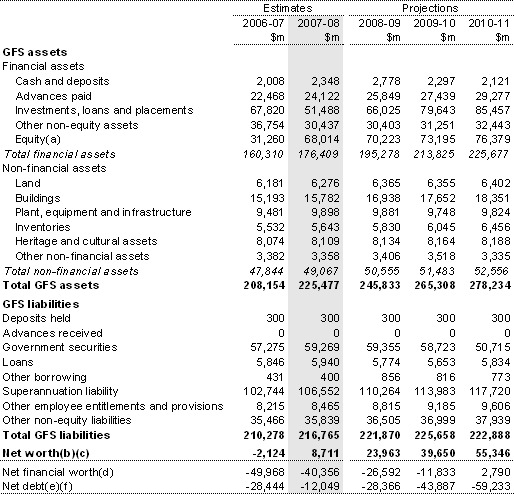
- Equity includes equity holdings of the Future Fund.
- The net worth estimates in this table differ from those presented elsewhere in the budget reflecting the treatment of GST as an Australian Government tax.
- Net worth is calculated as total assets minus total liabilities.
- Net financial worth equals total financial assets minus total liabilities. That is, it excludes non-financial assets.
- Net debt equals the sum of deposits held, advances received, government securities, loans and other borrowing, minus the sum of cash and deposits, advances paid, and investments, loans and placements.
- Includes the impact of the sale of the Government’s holding in Telstra. The net debt estimate in 2007-08 is a result of an assumption that the Future Fund will increasingly be invested in equities, which are not included in the calculation of net debt.
Table 3: Australian Government general government sector cash flow statement(a)
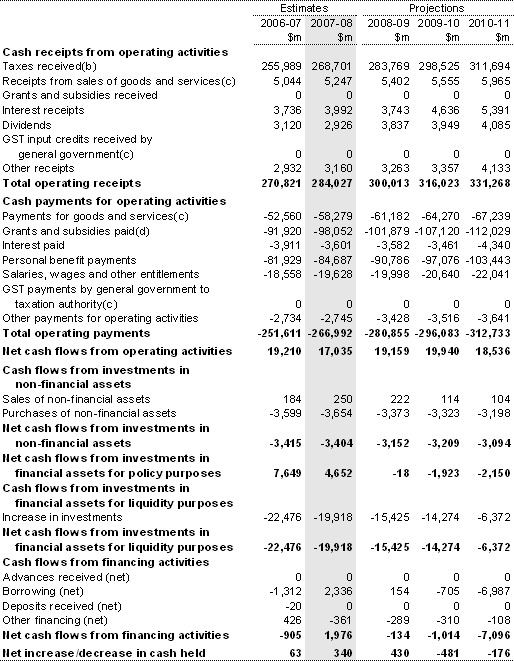
Table 3: Australian Government general government sector cash flow statement(a) (continued)
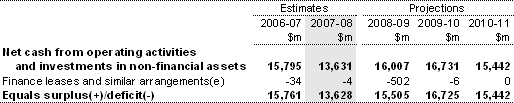
- A positive number denotes a cash inflow; a negative sign denotes a cash outflow.
- Includes GST cash receipts on an Australian Government tax basis, which is $6 million lower in 2007-08 than GST cash receipts measured on a State tax basis (as shown in Statement 10, Note 16).
- GST flows are excluded from these categories.
- Includes GST cash payments on an Australian Government tax basis.
- The acquisition of assets under finance leases decreases the surplus or increases the deficit. The disposal of assets previously held under finance leases increases the surplus or decreases the deficit.
Table 4: Australian Government general government sector statement of other economic flows
(reconciliation of net worth)
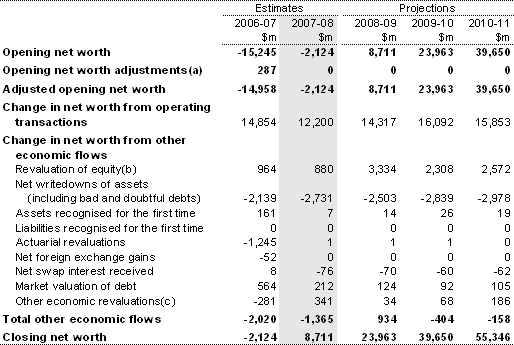
- Change in net worth arising from a change in 2005-06 outcomes.
- Revaluations of equity reflect changes in the market valuation of investments. This line also reflects any revaluations at the point of disposal or sale.
- Largely reflects revaluation of assets and liabilities.
Table 5: Australian Government public non-financial corporations operating statement
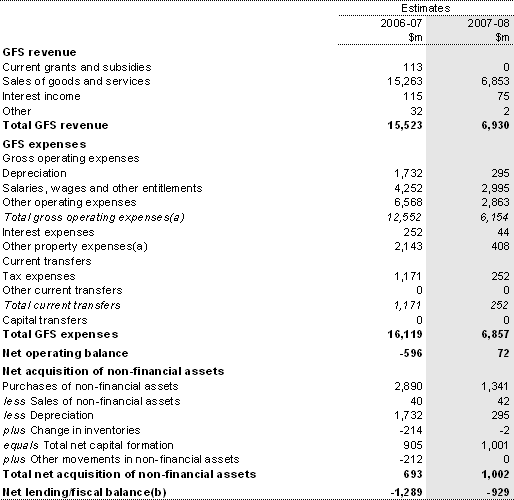
- Dividends paid to government have been reclassified from operating expenses to other property expenses.
- The term fiscal balance is not used by the ABS.
Note: The significant reduction in transactions in 2007-08 is due to the sale of the Government’s majority shareholding in Telstra.
Table 6: Australian Government public non-financial corporations balance sheet
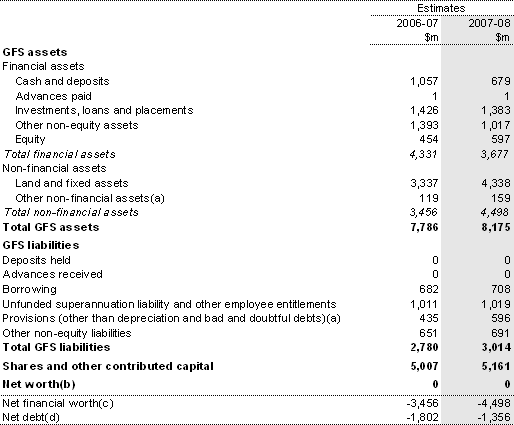
- Includes the elimination of commercial taxation adjustments.
- Net worth is calculated as total assets minus total liabilities minus shares and other contributed capital. A zero net worth is recorded as shares and contributed capital for the non-financial corporations controlled by the Government are valued at net assets (a proxy for market value for unlisted companies).
- Net financial worth equals total financial assets minus total liabilities minus shares and other contributed capital. That is, it excludes non-financial assets.
- Net debt equals the sum of deposits held, advances received, government securities, loans and other borrowing, minus the sum of cash and deposits, advances paid, and investments, loans and placements.
Table 7: Australian Government public non-financial corporations cash flow statement
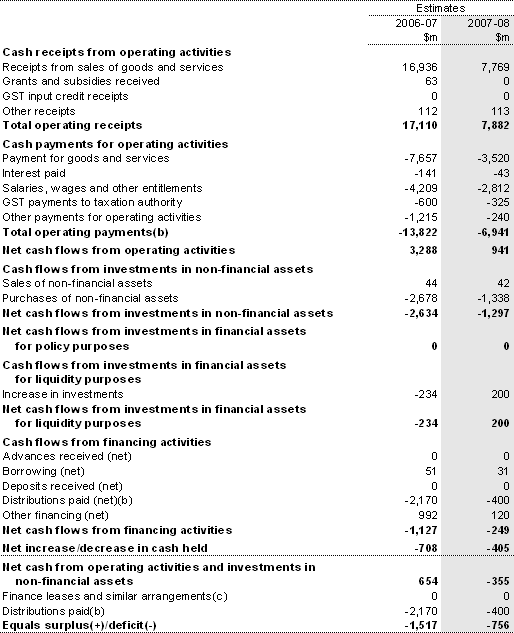
- A positive number denotes a cash inflow; a negative sign denotes a cash outflow.
- Dividends paid to government have been reclassified from operating payments to distributions paid.
-
The acquisition of assets under finance leases decreases the surplus or increases the deficit. The disposal of assets previously held under finance leases increases the surplus or decreases the deficit.
Note: The significant reduction in transactions in 2007-08 is due to the sale of the Government’s majority shareholding in Telstra.
Table 8: Australian Government total non-financial public sector operating statement
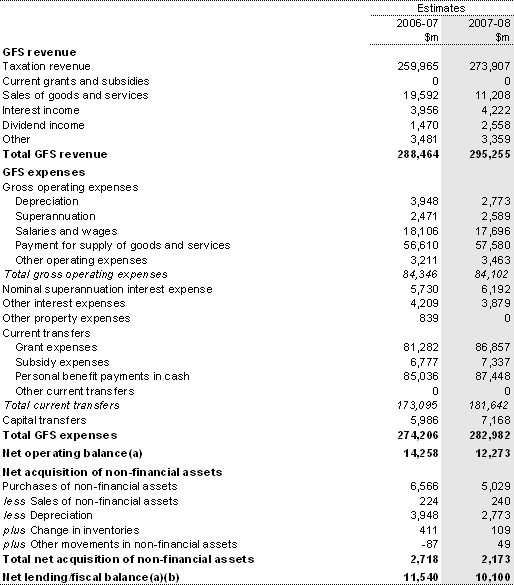
- The fiscal balance and net operating balance estimates in this table differ from those presented elsewhere in the Budget reflecting the treatment of the GST as an Australian Government tax.
- The term fiscal balance is not used by the ABS.
Table 9: Australian Government total non-financial public sector balance sheet
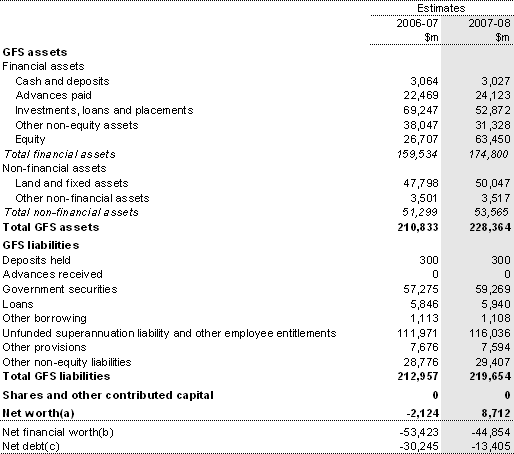
- Net worth is calculated as total assets minus total liabilities minus shares and other contributed capital.
- Net financial worth equals total financial assets minus total liabilities minus shares and other contributed capital. That is, it excludes non-financial assets.
- Net debt equals the sum of deposits held, advances received, government securities, loans and other borrowing, minus the sum of cash and deposits, advances paid, and investments, loans and placements.
Table 10: Australian Government total non-financial public sector cash flow statement(a)
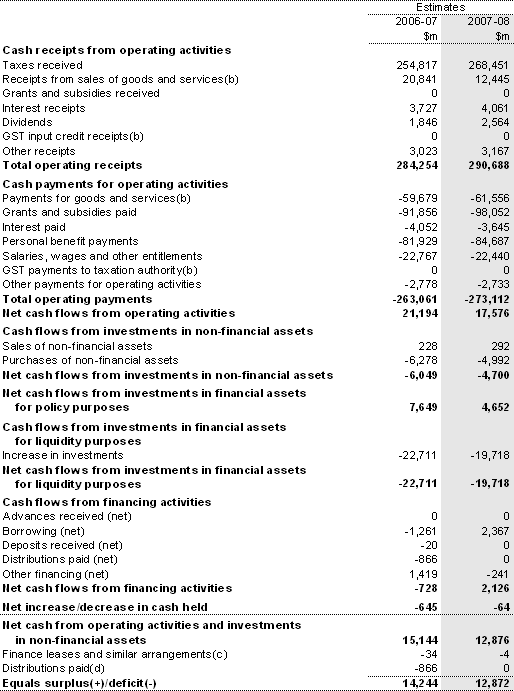
- A positive number denotes a cash inflow; a negative sign denotes a cash outflow.
- GST flows are excluded from these categories.
- The acquisition of assets under finance leases decreases the surplus or increases the deficit. The disposal of assets previously held under finance leases increases the surplus or decreases the deficit.
- Distributions paid comprise public non-financial corporations dividends to non-general government shareholders.
Table 11: Australian Government general government sector taxation revenue by source
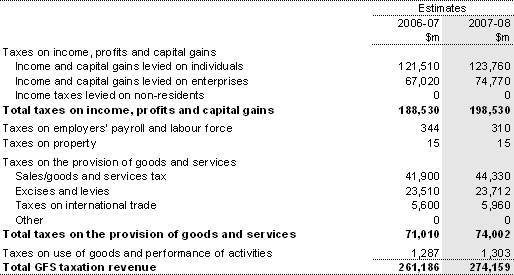
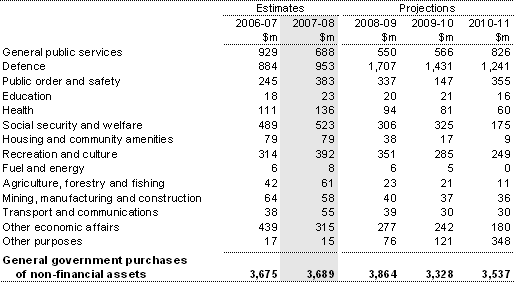
Table 12: Australian Government general government sector purchases of non-financial assets by function
1 Table 3 in Statement 8 shows the difference in the net operating and fiscal balance estimates resulting from the two treatments. The change in expenses when moving between the two GFS presentations of the estimates is less than the change in revenue.