




Statement 3: Fiscal Strategy and Outlook
Fiscal outlook
An underlying cash deficit of $57.6 billion is expected in 2009‑10 compared with an estimated deficit of $35.5 billion at UEFO. In accrual terms, a fiscal deficit of $53.1 billion is estimated for 2009‑10 compared to $33.3 billion at UEFO.
Table 3: Australian Government general government sector budget aggregates
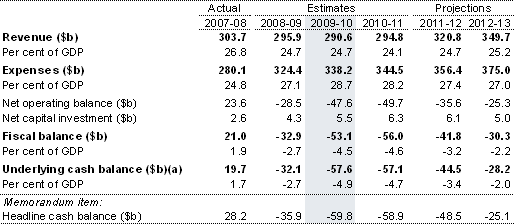
- Excludes expected Future Fund earnings.
Cash flows
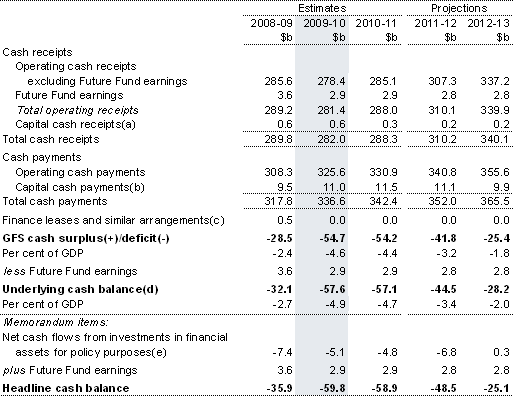
In 2009‑10, an underlying cash deficit of $57.6 billion is expected, compared with the UEFO estimate of $35.5 billion. A headline cash deficit of $59.8 billion is forecast for 2009‑10. Table 4 provides a summary of Australian Government general government sector cash flows.
Table 4: Summary of Australian Government general government sector cash flows
- Equivalent to cash receipts from the sale of non‑financial assets in the cash flow statement.
- Equivalent to cash payments for purchases of new and second‑hand non‑financial assets in the cash flow statement.
- The acquisition of assets under finance leases decreases the underlying cash balance. The disposal of assets previously held under finance leases increases the underlying cash balance.
- Excludes expected Future Fund earnings.
- Under the cash budgeting framework, these cash flows were referred to as net advances.
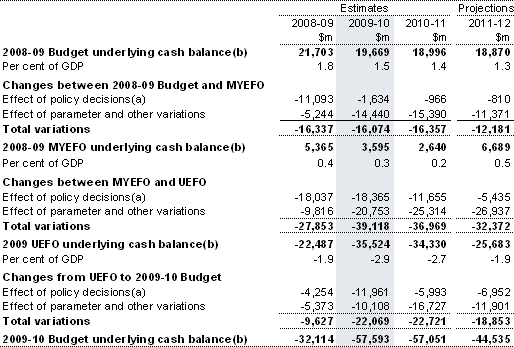
Table 5 provides a reconciliation of the variations in the underlying cash balance estimates.
Table 5: Reconciliation of 2008‑09 Budget, 2008‑09 MYEFO, UEFO and
2009‑10 Budget underlying cash balance estimates
- Excludes the public debt net interest effect of policy measures, and offsets from the contingency reserve for decisions taken. Includes the revised implementation arrangements for the Carbon Pollution Reduction Scheme.
- Excludes expected Future Fund earnings.
Variations to the underlying cash balance estimates
The 2009‑10 underlying cash deficit of $57.6 billion is $22.1 billion higher than estimated at UEFO.
Policy decisions
Policy decisions since UEFO are expected to increase the underlying cash deficit by $12.0 billion in 2009‑10.
Further detail of the impact of these policy decisions on the fiscal outlook is provided in the 'Variations to the fiscal balance' section below. More detail on the decisions can be found in Budget Paper No. 2, Budget Measures 2009‑10.
Parameter and other variations
Total parameter and other variations since UEFO have increased the forecast of the underlying cash deficit in 2009‑10 by $10.1 billion. Since the 2008‑09 Budget, parameter and other variations are expected to have a total negative impact of $173 billion on the underlying cash balance in the four years to 2011‑12.
Variations in receipts
Parameter and other variations since UEFO decrease taxation receipts by $14.5 billion in 2009‑10. The variations primarily relate to receipts from individuals, companies, and GST.
Since the 2008‑09 Budget, parameter and other variations are expected to decrease taxation receipts by around $173 billion in the four years to 2011‑12.
Non‑tax receipts in 2009‑10 is expected to be higher than forecast at UEFO, primarily reflecting an increase of $0.9 billion in the estimate of fee revenue from the Guarantee Scheme for Large Deposits and Wholesale Funding arising from growth in guaranteed liabilities over recent months.
Variations in payments
Total payment parameter and other variations have improved the underlying cash balance by $2.7 billion in 2009‑10 largely reflecting:
- a drawdown in the contingency reserve for decisions taken of $3.6 billion which have offset policy measures, including in relation to the nation building funds and Northern Territory Emergency Response;
- the impact of lower GST payments to the States of $2.1 billion reflecting a lower estimate of GST receipts; and
- the regular drawdown in the conservative bias provision of $1.3 billion.
These reductions are partially offset by an increase in payments in 2009‑10, largely reflecting an expected increase in unemployment benefit recipients, along with an expected increase in recipients for a range of other income support programs.
Variations in fiscal balance estimates
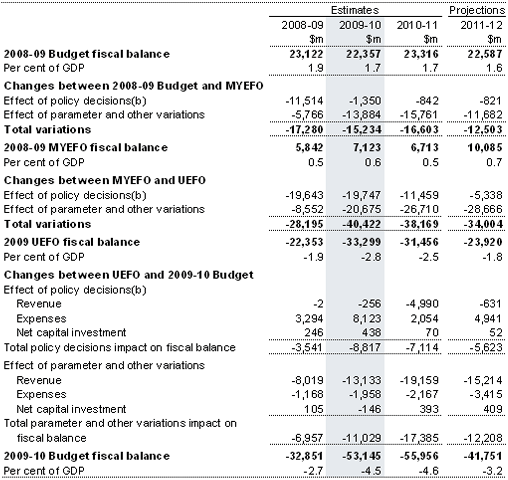
In 2009‑10, a fiscal balance deficit of $53.1 billion is estimated, compared with the deficit of $33.3 billion estimated at UEFO. Table 6 provides a reconciliation of the fiscal balance estimates.
Table 6: Reconciliation of 2008‑09 Budget, 2008‑09 MYEFO, UEFO and
2009‑10 Budget fiscal balance estimates(a)
- A positive number for revenue indicates an increase in the fiscal balance, while a positive number for expenses and net capital investment indicates a decrease in the fiscal balance.
- Excludes the public debt net interest effect of policy measures.
Variations in revenue estimates
As a result of the weakening in the Australian economic outlook, revenue for 2009‑10 has been revised down since UEFO. Parameter and other variations have reduced revenue by $13.1 billion in 2009‑10 since UEFO, with new policy decisions reducing revenue by $256 million.
Most revenue heads have been revised down in 2009‑10 since UEFO as nominal GDP is now forecast to contract. The largest revisions occur in individuals' income taxes, company tax and GST. Growth in individuals' incomes is expected to be weaker due to more moderate wage growth and expected falls in employment and unincorporated business and property income. Parameter and other variations have reduced individuals' income taxes by $6.3 billion since UEFO. Company profits are forecast to be lower than at UEFO, mainly reflecting continuing weakness in the domestic economy, resulting in company tax being revised down by $2.8 billion. Lower forecasts for consumption and dwelling investment have reduced the forecast for GST and other consumption tax revenues by $3.5 billion.
Non‑taxation revenue in 2009‑10 is expected to be higher than forecast at UEFO. The increase since UEFO mainly reflects fee revenue from the Guarantee Scheme for Large Deposits and Wholesale Funding being revised upwards by $0.9 billion in 2009‑10 as a result of higher than anticipated growth in guaranteed liabilities over recent months.
Further detail on how the revised outlook for the economy has affected individual revenue heads over the forward estimates is provided in Statement 5. An analysis of the sensitivity of the taxation revenue estimates to changes in the economic parameters is provided in Appendix A of Statement 3.
Variations in expense estimates
Since UEFO, estimated total expenses for 2009‑10 have increased by $6.2 billion reflecting increased expenses from new policy decisions of $8.1 billion, offset by parameter and other variations of $2.0 billion (see Table 6).
The reduction in estimated expenses arising from net parameter and other variations includes drawdowns from the contingency reserve, which are recorded as 'other variations'. The drawdown in the contingency reserve includes offsets for infrastructure payments to the States and Territories through the nation building funds, new Official Development Assistance policy measures, policy measures relating to the extension of the Northern Territory Emergency Response and the regular drawdown of the conservative bias allowance.
Major policy decisions since UEFO that have increased expenses include:
- increasing age, carer and disability pensions, as part of the Secure and Sustainable Pensions package, by $32.49 a week for full‑rate singles and $10.14 a week for full‑rate couples (combined) from 20 September 2009, at an expected cost of $2.7 billion in 2009‑10 and $14.2 billion over four years;
- extending Australia's defence force presence in Afghanistan for 2009‑10, and expanding our engagement there, will increase expenses by $1.1 billion in 2009‑10 relative to estimates at UEFO;
- investing in nation building infrastructure through the Building Australia Fund. As this infrastructure is largely funded through grants to the States and Territories, it is expected to increase expenses by $521 million in 2009‑10 and by $5.2 billion over four years;
- investing in innovation and higher education, as part of the An Innovation and Higher Education System for the 21st Century package of measures, at an expected cost of $917 million in 2009‑10 and $6.3 billion over the next four years. This includes spending out of the Education Investment Fund;
- supporting first home buyers through the extension of the First Home Owners Boost, at an expected cost of $486 million in 2009‑10 and $539 million over four years;
- investing in improved health infrastructure through the Health and Hospital Fund, which is expected to increase expenses by $465 million in 2009‑10 and by $2.8 billion over four years;
- investing in the clean energy initiative, at a cost of $400 million in 2009‑10 and $1.3 billion over four years (including funding through the Education Investment Fund);
- continuing the Northern Territory Emergency Response at an expected cost of $310 million in 2009‑10 and $807 million over four years; and
- extending the Solar Homes and Communities Plan (which provides rebates for the installation of solar panels), which is expected to increase expenses by $272 million in 2009‑10.
The impact of these policy decisions on expenses has been partially offset by a number of savings measures, including:
- temporarily reducing the superannuation co‑contribution, which is expected to reduce expenses by $385 million in 2009‑10 and by $1.4 billion over four years;
- repayment by the States and Territories of overpayments of GST compensation, resulting in a reduction in expenses of $302 million in 2009‑10;
- increasing the pension income test taper rate to better target pension payments, which is expected to save $134 million in 2009‑10 and $1.6 billion over four years;
- pausing indexation of the upper income thresholds for Family Tax Benefits and the Baby Bonus for a period of three years, which is expected to save $210 million in 2009‑10 and $1.4 billion over four years;
- savings in Defence expenses of $2.0 billion between 2010‑11 and 2012‑13; and
- better targeting of the Private Health Insurance Rebate, which is expected to increase expenses by $125 million in 2009‑10 but to reduce expenses by $1.9 billion between 2010‑11 and 2012‑13.
In 2009‑10, parameter and other variations have reduced forecast expenses by $2.0 billion since UEFO. These variations reflect:
- the drawdown of provisions for expenditure from the nation building funds and the national broadband network. In the 2008‑09 Budget, provision was made in the contingency reserve for expenditure of $2.5 billion in 2009‑10;
- a reduction in GST payments to the States and Territories of $2.1 billion in 2009‑10 and by $8.0 billion over four years;
- the drawdown of the conservative bias allowance1, reducing estimated expenses by $1.3 billion in 2009‑10; and
- the drawdown of provision in the contingency reserve for the Northern Territory Emergency Response by $310 million in 2009‑10 and by $520 million over four years.
These decreases in expenses are partially offset by:
- an increase in expected interest expenses of $1.0 billion in 2009‑10, primarily due to public debt interest costs; and
- higher than previously forecast number of Newstart recipients which, combined with higher than previously expected average benefit payments, has increased forecast expenses by $1.1 billion in 2009‑10.
In 2008-09, estimated total expenses have increased by $2.1 billion since UEFO. This reflects expenses parameter and other variations of $1.2 billion, offset by net new spending of $3.3 billion, including:
- investing $1.5 billion in infrastructure, including through the Building Australia Fund, the Education Investment Fund and the Health and Hospitals Fund; and
- providing the new carer supplement, which is expected to increase expenses by $373 million in 2008‑09.
More detailed information on expenses can be found in Statement 6. A full description of all policy measures since UEFO can be found in Budget Paper No. 2, Budget Measures 2009‑10.
Variations in net capital investment estimates
In 2009‑10, forecast net capital investment has increased by $292 million since UEFO. This primarily reflects the purchase of assets as part of the National Broadband Network initiative and investment as part of the Infrastructure Package. Further information on net capital investment can be found in Statement 6.
Net financial worth, net worth and net debt
Net debt for the Australian Government general government sector is forecast to be $53.7 billion in 2009‑10. Net financial worth and net worth for the Australian Government general government sector are forecast to be ‑$136.0 billion and ‑$38.7 billion in 2009‑10 respectively. The decline in net debt, net financial worth and net worth primarily reflects the increase in the estimated deficit.
Further details on the balance sheet are outlined in Statement 7 Asset and Liability Management.
Table 7 provides a summary of Australian Government general government sector net financial worth, net worth, net debt and net interest payments.
Table 7: Australian Government general government sector net financial worth,
net worth, net debt and net interest payments
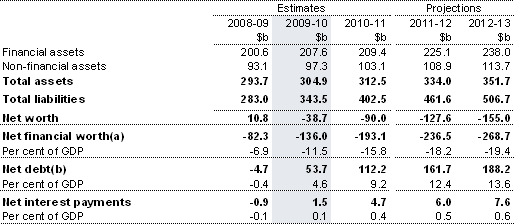
- Net financial worth equals total financial assets minus total liabilities. That is, it excludes non‑financial assets.
- Net debt equals the sum of deposits held, advances received, government securities, loans and other borrowing, minus the sum of cash and deposits, advances paid and investments, loans and placements.
1 The forward estimates include an allowance for the established tendency of expenses for existing Government policy (particularly demand driven programs) to be higher than estimated in the forward years. To offset this, the contingency reserve includes an allowance based on past experience to preserve the overall integrity of the forward estimates. This allowance, known as the conservative bias allowance, is progressively reduced so that the budget year conservative bias is zero by budget night.
If www.budget.gov.au responds slowly or you are having trouble downloading a document, try one of the Budget Website Mirrors
Note: Where possible, Budget documents are available in HTML and for downloading in Portable Document Format(PDF). If you require further information on any of the tables or charts on this website, please contact The Treasury.