




Statement 3:
Fiscal Strategy and Outlook
(Continued)
Delivering on the fiscal strategy
The Government is delivering on its two‑stage fiscal strategy.
Supporting the economy and jobs
Throughout late 2008 and 2009, the Government took steps to support the economy.
The automatic stabilisers were allowed to operate and the budget moved into deficit as the impact of slower economic growth was felt on Government revenues. This provided a natural cushion for the economy against the effects of slower economic growth.
In addition, the Government put in place specific measures to support jobs, households and those sectors of the economy most affected by the global financial crisis. This included delivering timely, targeted and temporary fiscal stimulus to the economy. Along with the significant stimulus provided by the Reserve Bank of Australia cutting the official cash rate, this supported economic growth at a critical time.
It is estimated that the Government's fiscal stimulus measures added around 2 percentage points to GDP growth in 2009. The Australian economy grew by 1.4 per cent in 2009, the strongest of any of the world's advanced economies. Without the stimulus the Australian economy would have contracted by 0.7 per cent in 2009.
The stimulus was designed to be withdrawn as the economy recovered and private sector demand strengthened. The withdrawal of stimulus will detract around 1 percentage point from GDP growth over 2010 and ¾ of a percentage point over 2011. Private sector demand is now expected to drive economic growth.
Non‑stimulus policy measures were funded through a reprioritisation of existing policies, ensuring that there was no deterioration in the budget position as a consequence of these decisions.
Implementing the deficit exit strategy
With the economic recovery under way, the Government's focus has shifted to implementing its strategy to return the budget to surplus as quickly as possible. With the implementation of this strategy, the budget is now expected to return to surplus in 2012‑13, three years earlier than previously projected.
Allowing tax receipts to recover naturally
The commitment to allow the natural increase in tax receipts associated with an emerging economic recovery to flow through to the budget is a significant one. This commitment has delivered a substantial improvement to the budget position.
Inherent lags in the tax system mean that the weaker economic outcomes seen during the global recession are still hindering the improvement in receipts in 2009‑10 despite an improvement in economic growth. Tax receipts remain around $110 billion lower than forecast at the 2008‑09 Budget.
The recovery in tax receipts has occurred while maintaining the commitment to a tax‑to‑GDP ratio below the 2007‑08 level on average. Tax receipts are estimated to be 21.0 per cent of GDP in 2010‑11, well below the 2007‑08 level of 23.6 per cent of GDP. Tax receipts have been held below the 2007‑08 level, on average, in the medium‑term fiscal projections, consistent with the fiscal strategy.
Fiscal discipline — the 2 per cent cap on spending
The Government's action to consolidate spending has played a critical role in improving the fiscal outlook.
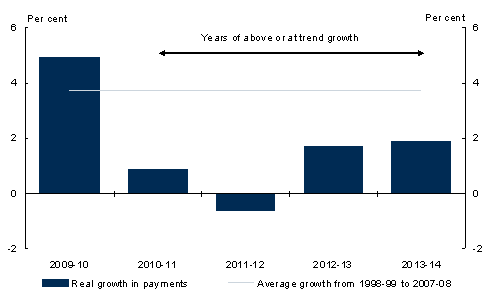
The Government has met its commitment to keep real growth in spending to 2 per cent or less in years when the economy is expected to grow above trend. This has meant the Government has kept growth below 2 per cent from 2010‑11 to 2013‑14 (see Table 2).
Table 2: Delivering on the 2 per cent commitment

The commitment to hold real growth in spending to 2 per cent has placed — and will continue to place — a significant restraint on Government expenditure. Prior to the global financial crisis, real payments growth was above 2 per cent in eight out of the previous ten years and the average over this period was around 3.7 per cent. The four year period to 1990‑91 was the last time that real growth in payments was as low as is expected from 2010‑11 to 2013‑14.
Chart 1: Real growth in payments
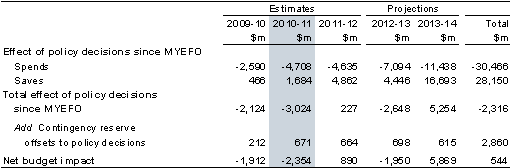
In addition to meeting the 2 per cent commitment, the Government has offset all new spending measures across the forward estimates, achieving a net save of $544 million.
This net save is outlined in the table below. The net effect of policy decisions taken since MYEFO takes into account amounts that have previously been provided for in the contingency reserve. As a result, these decisions have no net impact on the budget position. These principally relate to official development assistance and exceptional circumstances provisioning for drought.
Table 3: Delivering fiscal reprioritisation(a)
- Underlying cash balance basis.
Details of the measures in the Budget are outlined in Budget Paper No. 2, Budget Measures 2010‑11.
Continuing budget surpluses
The focus of the fiscal strategy in future years will remain on returning the budget to surplus, including by continuing to reprioritise existing expenditure, consistent with 2 per cent real expenditure growth, and by allowing the level of tax receipts to continue to recover naturally as the economy improves.
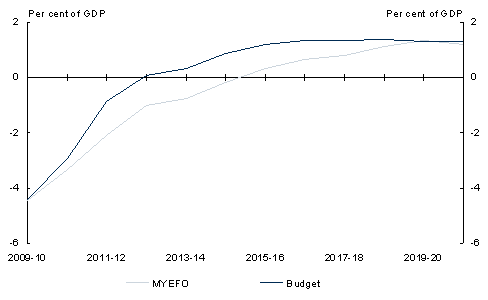
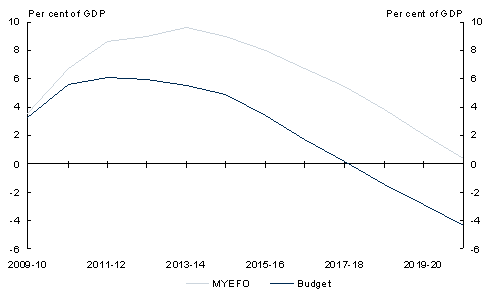
Once the budget returns to surplus, and while the economy is growing at or above trend, the Government will maintain expenditure restraint by retaining a 2 per cent annual cap on real spending growth, on average, until surpluses are at least 1 per cent of GDP. On current projections, this would be achieved in 2015‑16 and net debt would return to zero in 2018‑19, three years ahead of the MYEFO projections (Charts 2 and 3).
Chart 2: Underlying cash balance projected to 2020‑21
Source: Treasury projections.
Chart 3: Government net debt projected to 2020‑21
Source: Treasury projections.
Fiscal consolidation
The expected fall in the size of the deficit represents a tightening of the fiscal stance of an average of 1½ per cent of GDP a year, the most substantial fiscal consolidation in Australia's modern history (see Box 1 below.) Australia's fiscal consolidation also compares favourably with that of the major advanced economies (see Chart 4).
Chart 4: Net debt and deficits of the G7 in 2013 and Australia in 2013‑14
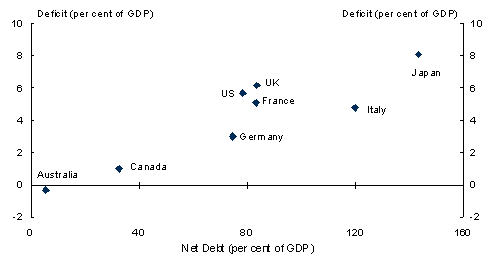
Note: Australian data are for the Australian Government general government sector and refer to financial year data for 2013‑14. Data for all other economies are total Government and refer to calendar year 2013.
Source: IMF World Economic Outlook April 2010 and Treasury.
Box 1: Returning the budget to surplus
The application of the deficit exit strategy from 2010‑11, the first year of above‑trend growth since the global financial crisis, combined with the planned withdrawal of economic stimulus, generates a substantial fiscal consolidation over the forward estimates.
Chart A: Australian fiscal consolidations
Change in the underlying cash balance
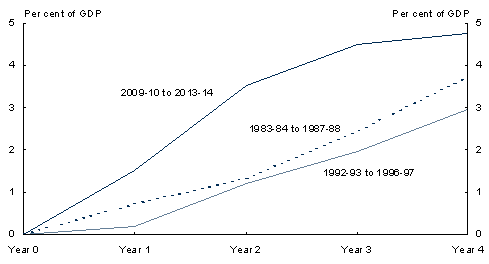
This consolidation is projected to be considerably faster than after previous economic downturns (Chart A). The fiscal strategy is expected to result in the underlying cash balance improving by close to 4 percentage points of GDP in the two years after the deficit reaches its peak in 2009‑10. This is more than double the pace of consolidation that followed the 1980s and 1990s recessions.
The faster improvement in the underlying cash balance in the current episode is helped by the timely implementation of economic stimulus. The economic stimulus was more closely synchronised with the economic cycle, with stimulus being withdrawn sooner, coinciding with the natural recovery in tax receipts.
If www.budget.gov.au responds slowly or you are having trouble downloading a document, try one of the Budget Website Mirrors
Note: Where possible, Budget documents are available in HTML and for downloading in Portable Document Format(PDF). If you require further information on any of the tables or charts on this website, please contact The Treasury.