




Statement 3: Fiscal Strategy and Outlook (Continued)
Fiscal outlook
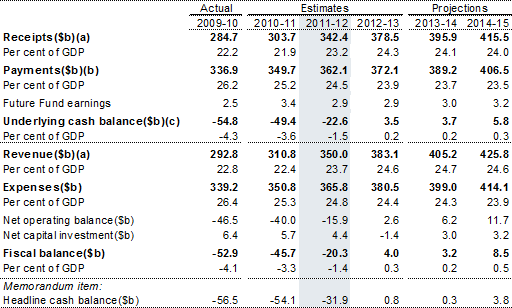
An underlying cash deficit of $22.6 billion is expected in 2011‑12, compared with an estimated deficit of $12.3 billion at MYEFO. In accrual terms, a fiscal deficit of $20.3 billion is expected for 2011‑12.
Table 4: Australian Government general government sector budget aggregates
- Includes expected Future Fund earnings.
- Equivalent to cash payments for operating activities, purchases of non‑financial assets and net acquisition of assets under finance leases.
- Excludes expected Future Fund earnings.
Underlying cash balance estimates
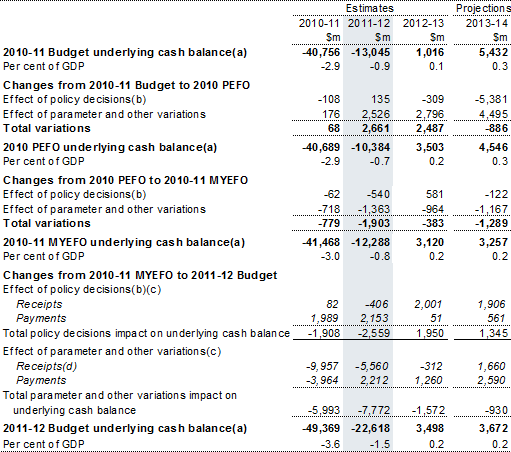
The increase in the estimated 2011‑12 underlying cash deficit since MYEFO is largely the result of changes in economic conditions reducing tax receipts and increasing a range of cash payments.
Policy decisions since MYEFO have reduced the underlying cash balance for 2011‑12 by $2.6 billion. Over the forward estimates to 2014‑15, Government decisions are expected to improve the underlying cash balance by $2.7 billion, consistent with the Government's fiscal strategy of returning the budget to surplus (see Table 3), before accounting for offsets to new spending previously provisioned in the Contingency Reserve.
Table 5 provides a reconciliation of the variations in the underlying cash balance since the 2010‑11 Budget.
Table 5: Reconciliation of 2010‑11 Budget, 2010 PEFO, 2010‑11 MYEFO
and 2011‑12 Budget underlying cash balance estimates
- Excludes expected Future Fund earnings.
- Excludes secondary impacts on public debt interest of policy decisions and offsets from the contingency reserve for decisions taken.
- A positive number for receipts indicates an increase in the underlying cash balance, while a positive number for payments indicates a decrease in the underlying cash balance.
- Receipts will differ from the cash receipts reconciliation published in Budget Statement 5 because they exclude Future Fund earnings.
Receipt estimates
Receipts have been revised down by $9.9 billion in 2010‑11 and $6.0 billion in 2011‑12 since MYEFO largely reflecting the revision to economic parameters and the legacy of the global financial crisis.
New policy decisions have increased receipts by $82 million in 2010‑11 and reduced receipts by $406 million in 2011‑12. Parameter and other variations, including the economic impacts of natural disasters, have reduced receipts by $10.0 billion in 2010‑11 and $5.6 billion 2011‑12 since MYEFO.
Major policy decisions that have increased receipts over the forward estimates period from 2010‑11 to 2014‑15 include:
- the introduction of a temporary flood and cyclone reconstruction levy from 1 July 2011. This measure is expected to raise $1.7 billion over the forward estimates;
- the current 'statutory formula' for valuing car fringe benefits will be reformed by replacing progressive rates with a single 20 per cent statutory rate. This will be phased in over four years and apply to new contracts entered into after 7:30pm (AEST) on 10 May 2011. This measure is expected to increase the underlying cash balance by $970 million over the forward estimates period;
- phasing out the dependent spouse tax offset (DSTO) for taxpayers with a dependent spouse born on or after 1 July 1971. This measure has an ongoing gain to receipts which is estimated to be $755 million over the forward estimates period;
- removing the ability of minors (children under 18 years of age) to access the low income tax offset (LITO) to reduce tax payable on their unearned income with effect from 1 July 2011. This measure has an ongoing gain to receipts estimated to be $740 million over the forward estimates; and
- the removal of the Entrepreneurs' Tax Offset (ETO), with effect from the 2012‑13 income year. This measure has an ongoing gain to receipts estimated to be $365 million over the forward estimates.
The impact of these policy decisions on receipts has been partially offset by a number of decisions that have reduced receipts, including:
- allowing low and middle income earners to receive 70 per cent of the benefits of the LITO through a reduction in tax payable on their regular pay, rather than only half as provided under existing arrangements. The remaining 30 per cent of the LITO benefit will be paid as a lump sum on assessment of income tax returns. This is estimated to reduce receipts by $1.3 billion over the forward estimates;
- the delay in the introduction, until 1 December 2011, and other arrangements for excise and excise‑equivalent customs duty on alternative fuels. This is expected to reduce receipts over the forward estimates period by $641 million which is almost entirely offset by a reduction in related payments;
- allowing small businesses to claim up to $5,000 as an immediate deduction for motor vehicles, with effect for vehicles acquired from the 2012‑13 income year. The remainder of the motor vehicle value will be pooled in the general small business pool. This measure is estimated to have a cost to receipts of $350 million over the forward estimates period;
- increasing the Medicare Levy low income tax thresholds to $18,839 for individuals and $31,789 for families, with effect from 1 July 2010. This has an ongoing cost to receipts estimated to be $125 million over the forward estimates; and
- an income tax exemption for certain Category C clean up and recovery grants paid to small businesses and primary producers under the Natural Disaster Relief and Recovery Arrangements. This measure is expected to cost an estimated $98 million over the forward estimates.
Payment estimates
Since MYEFO, estimated total cash payments for 2011‑12 have increased by $4.4 billion, reflecting new policy decisions of $2.2 billion and parameter and other variations of $2.2 billion.
Major policy decisions since MYEFO that have increased cash payments in 2011‑12 include:
- the extension of Australia's military operations in Afghanistan and the Middle East Area of Operations, East Timor and the Solomon Islands until June 2012 at a cost of $1.1 billion in 2011‑12 ($1.5 billion over the five years to 2014‑15);
- the Health and Hospitals Fund (HHF) Regional Priority Round, which allocates $110 million in 2011‑12 ($969 million over four years) to improving regional health services, including through new hospital beds, operating theatres and patient accommodation. This is part of a total $1.8 billion investment over 6 years in new health infrastructure, which includes funding for the Royal Hobart and Port Macquarie Base Hospitals announced at MYEFO and $475 million to fund a further Regional Priority Round from the HHF; and
- enhancing mental health services by providing a more coordinated approach to mental health care and increasing access to services. The mental health initiatives are expected to increase payments by $1.5 billion over five years to 2015‑16.
These increases in cash payments have been partially offset in 2011‑12 by decisions that have reduced payments, including:
- achieving increased operational efficiencies in the Department of Defence that are expected to reduce payments by $227 million in 2011‑12 ($1.2 billion over four years);
- deferring payments to the Victorian and NSW governments for infrastructure projects including for the Victorian Regional Rail Link, the upgrade of the Princes Highway between Traralgon and Sale and the Northern Sydney Freight Corridor, which is expected to reduce payments by $369 million in 2011‑12 ($620 million over five years to 2014‑15). These deferrals were previously announced as part of the Government's response to the recent natural disasters;
- increasing the rate of the efficiency dividend (to 1.5 per cent in 2011‑12 and 2012‑13 and 1.25 per cent in 2013‑14 and 2014‑15), reducing payments by $126 million in 2011‑12 ($1.1 billion over four years to 2014‑15);
- reducing and deferring funding for the Carbon Capture and Storage Flagships program, of $127 million in 2011‑12 ($671 million over five years to 2014‑15);
- reducing the discounts applying to payments under the Higher Education Contribution Scheme, saving $62 million in 2011‑12 ($479 million over four years); and
- reallocating funding from the Priority Regional Infrastructure Program to support flood recovery efforts in regional Australia, reducing payments by $50 million in 2011‑12 ($350 million over four years).
The Government has also decided to provide significant support to individuals, businesses and governments affected by recent natural disasters, increasing payments by $1.3 billion in 2010‑11 ($1.4 billion over five years to 2014‑15).
Further details of Government policy decisions are provided in Budget Paper No. 2, Budget Measures 2011‑12. The expense estimates provided in Budget Paper No. 2 are in accrual terms and may not align exactly with the underlying cash payments figures provided in this Statement.
Major increases in expected payments in 2011‑12 as a result of parameter and other variations since MYEFO include:
- offshore asylum seeker management costs largely reflecting the higher than previously expected number of irregular maritime arrivals ($585 million in 2011‑12 and $825 million from 2011‑12 to 2013‑14);
- the re‑profiling of spending under the Restoring the Balance in the Basin, National Water Security Plan for Cities and Towns, and National Urban Water and Desalination Plan as well as other Water for the Future programs (resulting in an increase in payments of $463 million in 2011‑12, but an overall reduction in payments of $317 million over four years to 2013‑14 including a reduction in payments of $1.2 billion in 2010‑11). This re‑profiling reflects lengthy negotiations to finalise funding agreements, project delays due to recent weather events, and the impact of state restrictions on trade on the settlement of water entitlement purchases;
- natural disaster relief payments to the States under the Natural Disaster Relief and Recovery Arrangements reflecting the natural disasters in 2010‑11 as well as in earlier years ($887 million in 2011‑12). Refer to Box 1 for further details of the recent natural disasters;
- residential aged care subsidies, owing to an increase in the estimated average subsidy for aged care residents based on recent trends in demand for residential care places ($331 million in 2011‑12 and $1.1 billion over four years);
- Medicare Services payments mainly stemming from the extension of the Chronic Disease Dental Scheme (CDDS) to 31 December 2011 as a result of the Senate disallowing the determination to close the program. The closure of the CDDS remains the Government's policy. Over the forward years, Medicare Services payments are lower than forecast at MYEFO, mainly because of larger than previously expected savings from the capping of rebates for obstetrics and assisted reproductive technology services announced in the 2009‑10 Budget. The expected overall change is an increase in payments of $265 million in 2011‑12 but a reduction in payments of $142 million over four years to 2013‑14;
- road transport payments to the States and Territories, owing to a bring forward of payments to the NSW Government to reflect the Hunter Expressway and Kempsey Bypass projects progressing faster than originally anticipated ($233 million in 2011‑12 but neutral over the forward estimates). Offsetting these bring forwards, some Queensland construction that was to have been undertaken in 2010‑11 has been delayed because of the floods and is now expected to be undertaken from 2011‑12;
- Disability Support Pension payments, reflecting an increase in expected average payments along with higher indexation forecasts consistent with increases in forecast wage and price inflation ($214 million in 2011‑12 and $1.1 billion over four years to 2013‑14); and
- income support for seniors, reflecting higher than previously forecast payment indexation, consistent with updated wage and price inflation forecasts over the forward estimates ($266 million in 2011‑12 and $1.3 billion over four years to 2013‑14).
Major reductions in expected payments in 2011‑12 as a result of parameter and other variations since MYEFO include:
- GST payments to the States and Territories consistent with a reduction in GST receipts ($1.7 billion in 2011‑12 and $5.9 billion over four years to 2013‑14);
- improving Australia's energy efficiency program payments reflecting lower than anticipated demand in the Renewable Energy Bonus Scheme — Solar Hot Water Rebate program, the Solar Homes and Communities Plan and the Home Insulation Safety Plan ($254 million in 2011‑12 and $524 million over four years to 2013‑14);
- Cleaner Fuels Scheme payments, because of a reduction in the forecast quantity of Liquid Petroleum Gas (LPG) being imported or manufactured since MYEFO ($215 million in 2011‑12 and $455 million over four years to 2013‑14). The Government has announced it will amend the Scheme by replacing the payments of grants with revised taxation arrangements from 1 December 2011. This decision reduces both payments and receipts, so that its impact on the underlying cash balance is broadly neutral; and
- Superannuation Co‑contribution Scheme payments, partly because of the expectation that a lower than previously anticipated number of eligible taxpayers will choose to make personal contributions to trigger the Government's co‑contribution ($143 million in 2011‑12 and $588 million over four years to 2013‑14).
As a consequence of the weaker fiscal outlook in the near term, and higher interest rates, net interest payments have increased by $588 million in 2011‑12 and $3.1 billion over four years to 2013‑14.
Consistent with previous budgets, the underlying cash balance has been improved by the regular draw down of the conservative bias allowance. Details of this draw down are provided in Appendix B of Statement 6.
In 2010‑11, a number of parameter and other variations have reduced expected payments, including GST payments to the States and Territories, the reprofiling of water programs and estimates adjustments for Defence. These adjustments were partly offset by higher natural disaster relief payments, increased residential aged care subsidies and costs associated with accommodating and processing irregular maritime arrivals.
Fiscal balance estimates
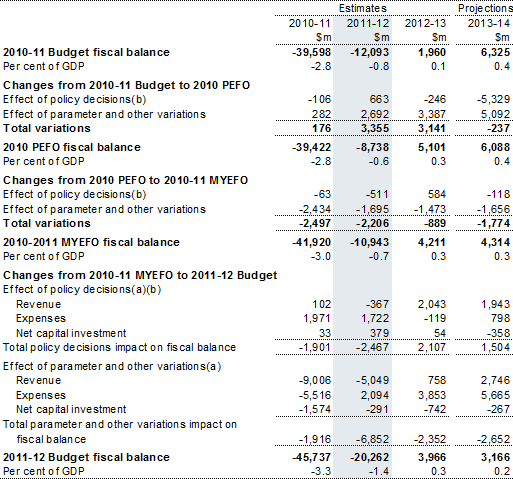
The fiscal deficit is estimated to be $20.3 billion in 2011‑12, an increase of $9.3 billion since MYEFO.
Table 6 provides a reconciliation of the variations in the fiscal balance since the 2010‑11 Budget.
Table 6: Reconciliation of 2010‑11 Budget, 2010 PEFO, 2010‑11 MYEFO
and 2011‑12 Budget fiscal balance estimates
- A positive number for revenue indicates an increase in the fiscal balance, while a positive number for expenses and net capital investment indicates a decrease in the fiscal balance.
- Excludes secondary impacts on public debt interest of policy decisions and offsets from the contingency reserve for decisions taken.
Revenue estimates
Changes in revenue are generally driven by the same factors as receipts, though differences arise where revenue raised in a given year is not received in that year (see Budget Statement 5, Appendix E: Taxation Revenue Recognition, for further information on the difference between accrual and cash estimates).
Expense estimates
Movements in accrual expenses over the forward estimates are broadly similar to the movements in cash payments. The key exceptions include:
- changes in net capital investment, largely relating to capital reprogramming by Defence and also in relation to a range of water initiatives, which are reported as cash payments;
- superannuation benefits and the Superannuation Co‑contribution Scheme, where there are differences between timing of cash payments and accruing expenses; and
- the Natural Disaster Relief and Recovery Arrangements, where expenses are being recognised at a different time to the cash payments advanced to Queensland and Victoria.
More detailed information on expenses can be found in Statement 6.
Net capital investment estimates
Forecast net capital investment for 2011‑12 is largely unchanged since the MYEFO.
In 2010‑11 net capital investment is forecast to be $1.5 billion lower than forecast in the MYEFO, largely reflecting the reprogramming of Defence investments and a range of water initiatives.
The higher exchange rate since MYEFO has also resulted in the forecasts of net capital investment being reduced across the forward estimates.
More detailed information on net capital investment can be found in Statement 6.
Net financial worth, net worth and net debt
The downward revisions to estimated tax receipts in this year and next, and higher than expected payments owing, in part, to the recent natural disasters, have contributed to higher estimated net debt, and lower net worth and net financial worth than was forecast in the MYEFO.
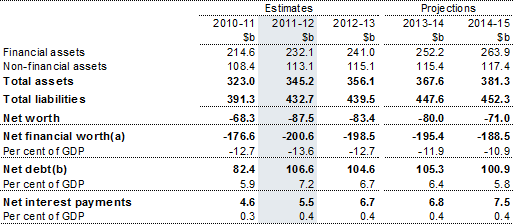
Net debt is forecast to peak in 2011‑12 at $106.6 billion (or 7.2 per cent of GDP), an increase of $12.2 billion from the MYEFO. Net debt is expected to reduce to 5.8 per cent of GDP in 2014‑15.
The change to the projected peak in net debt is driven primarily by an increase in the amount of Commonwealth Government Securities on issue largely reflecting the weaker fiscal outlook in 2010‑11 and 2011‑12, though this is partially offset by an increase in the Government's investment in Residential Mortgage‑Backed Securities, an increase in Australia's quota with the International Monetary Fund, and an increase in the Future Fund's asset values in 2010‑11.
The Australian Government's net debt remains extremely low by international standards. The average net debt level in the major advanced economies, measured for all levels of government, is projected to be around 80 per cent of GDP in 2011. Net debt in the major advanced economies is expected to reach an average of around 90 per cent of GDP in 2016, over 12 times higher than the expected peak in the Australian Government's net debt.
The changes to net debt described above also impact on net financial worth and net worth.
- Net financial worth is estimated to be ‑$200.6 billion in 2011‑12, $17.2 billion lower than the MYEFO estimate.
- Net worth is estimated to be ‑$87.5 billion in 2011‑12, $15.6 billion lower than the MYEFO estimate.
In addition to the drivers for change to the net debt position, the change in net financial worth and net worth also reflect the revaluation of the Government's superannuation liability.
Further details on the balance sheet are outlined in Statement 7, Asset and Liability Management.
Table 7 provides a summary of Australian Government general government sector net financial worth, net worth, net debt and net interest payments.
Table 7: Australian Government general government sector net financial
worth, net worth, net debt and net interest payments
- Net financial worth equals total financial assets minus total liabilities. That is, it excludes non‑financial assets.
- Net debt equals the sum of deposits held, advances received, government securities, loans and other borrowing, minus the sum of cash and deposits, advances paid and investments, loans and placements.
Medium term fiscal outlook
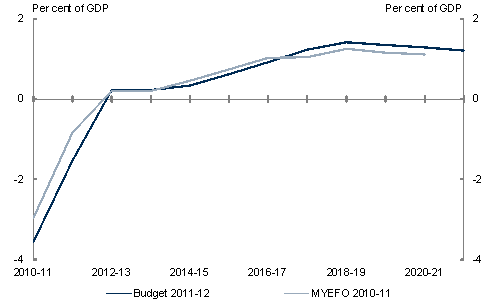
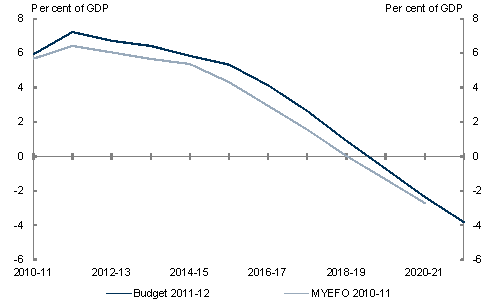
On current projections, it is expected that the budget surplus will reach 1 per cent of GDP in 2017‑18. Net debt is projected to peak in 2011‑12 at 7.2 per cent of GDP and fall to zero by 2019‑20.
Chart 3: Underlying cash balance projected to 2021‑22
Source: Treasury projections.
Chart 4: Government net debt projected to 2021‑22
Source: Treasury projections.
If www.budget.gov.au responds slowly or you are having trouble downloading a document, try one of the Budget Website Mirrors
Note: Where possible, Budget documents are available in HTML and for downloading in Portable Document Format(PDF). If you require further information on any of the tables or charts on this website, please contact The Treasury.