




Statement 4: Opportunities and Challenges of an
Economy in Transition (Continued)
Laying the groundwork for transition while managing the boom
The right policy settings are needed for Australia to take advantage of the opportunities and challenges presented by the rise of Asia, and to lay the foundations for future growth.
Critically, the Government's strict fiscal strategy built on a return to budget surplus in 2012‑13 will ensure that it does not compound price pressures that are likely to re‑emerge as the investment boom gathers pace. The Government's fiscal strategy will also support the strengthening of the Government's finances over time. A strong government balance sheet affords the necessary ongoing flexibility for the budget position to vary in line with economic conditions and to respond to unforseen events — promoting macroeconomic stability.
The Government's reform agenda will assist in laying the groundwork for managing the current boom and spreading the benefits to more Australians. In particular, investments in skills, infrastructure and innovation will support productivity growth and the flexibility of the economy. The participation package in this Budget will further support labour force participation and social inclusion. By doing so, these reforms build capacity to take advantage of current global demands while providing opportunities across diverse industries and regions. These policies are designed to accommodate transition, not resist the economic forces at work.
Such policies benefit the economy at the local and macroeconomic level. There are many examples of local communities successfully making such shifts, facing challenges of adjustment and maintaining a vibrant society. This has been the case even where large local employers have relocated or closed down. Rather than resisting change, these communities have overcome short‑term adversity by sharpening their natural advantages and reviving their fortunes (Box 5).
Building flexibility and productive capacity
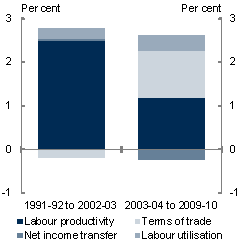
Australia's strong terms of trade — reflecting an increase in prices paid by foreigners for what we produce — has led to improvements in the purchasing power and living standards of Australians in recent times. Since the start of the mining boom in 2003‑04, improvements in Australia's terms of trade have provided nearly half of national income growth (Chart 23).
Chart 23: Gross national income (GNI) and labour productivity growth
Real GNI growth by source
Labour productivity decomposition(a)
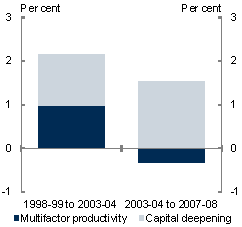
- The time periods for the labour productivity decomposition reflect the productivity growth cycles selected by the ABS.
Source: ABS 5206.0, 6202.0, 3101.0, 5260.0.55.002 and Treasury.
However, Australia's productivity growth — our ability to produce more per hour worked — has been weaker during the mining boom than in the 1990s, when previous economic reforms delivered strong growth. Underlying the decline in productivity performance has been a decline in multifactor productivity growth (the efficiency with which labour and capital inputs are used). Indeed, between 2003‑04 and 2007‑08 multifactor productivity growth was negative. One‑off factors such as lags between investment and production can explain only a part of the decline.
Box 5: Case study of a community adapting to change — Geelong
Founded in the 1830s, Geelong became one of Australia's premier port towns. In the second half of the 19th century, it shipped the agricultural exports of western Victoria around the world. In the 20th century, rapid advances in technology and the advent of mass production techniques provided a new economic opportunity for Geelong. A strong manufacturing sector emerged, providing work for Geelong's growing population. Large firms, such as Ford, also spawned a wide range of related and supporting industries.
In the early 1990s, the recession and the collapse of the Pyramid Building Society hit the Geelong region hard. Mirroring events in the broader economy, jobs were also lost in textiles, clothing, footwear and leather manufacturing. The population declined and the region was under pressure. Some firms opted to relocate or close. Developments in technology also meant that certain occupations became redundant.
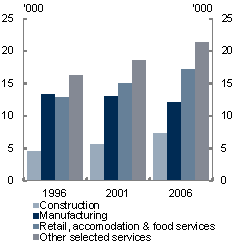
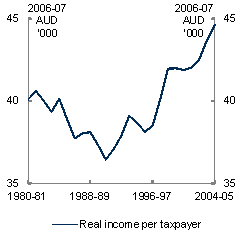
Yet new technologies and a competitive economic environment provided new opportunities and generated improved living standards (Chart 24). Many manufacturing firms abandoned traditional, labour‑intensive modes of production. Firms, including those in the growing biotech industry, switched to capital‑intensive and knowledge‑intensive approaches. These firms focused on research and development and required workers with design, engineering and science skills. While manufacturing is still a large employer in Geelong, employment in services (across a range of areas) has grown considerably over the past decade (DPCD 2010a and 2010b).
Chart 24: Employment by industry and income, Greater Geelong
Numbers employed
Real income
Note: 'Other selected services' include education and training, health and social assistance and professional, science and technical services.
Source: ABS 2003.0 and BITRE taxable income database.
With the terms of trade projected to decline over time as the global supply of mineral resources responds to high commodity prices, movements in the terms of trade can be expected to eventually detract from national income growth even while the boom continues to boost investment and real output.
In the long-run, it is labour force participation and productivity growth, rather than continually rising export prices, that determines Australian living standards.
Supporting workforce participation across the community
Reducing disincentives to work and providing well-targeted assistance for those not employed will encourage labour force participation. This will strengthen the economy and also ensure that the benefits of transition reach more individuals in the community, including groups with typically low participation in the workforce.
The Building Australia's Future Workforce package in this Budget is an example of this approach. It focuses on providing appropriate incentives and support for families on income support, younger people, the long‑term unemployed and people with disability who are capable of working — balancing increased participation requirements with additional services and support such as training, childcare and employment services and better rewards for workers and employers.
The Government's productivity agenda
Boosting productivity does not mean working harder and longer. Rather it means firms and people working more efficiently by having the infrastructure, investments, skills, resources and flexibility to produce more with less. Improving productivity frees up resources to respond to changes in the economy's structure and move to higher value uses as well as allowing people more freedom in the choices they make about work and leisure.
Improving productivity is not just about more physical investments and more skills. It is also about fostering an environment that encourages innovation and where people and resources can move to where they are most valuable. Burdening individuals and firms with unnecessary and restrictive regulations runs counter to innovation and productivity. Unleashing these positive contributors to future prosperity requires barriers to the efficient functioning of markets to be removed, along with proactive measures to address market failures such as the absence of a market price on carbon.
The Australian Government has a broad ranging and extensive productivity agenda that is built around three broad aims:
- achieving continued macroeconomic stability — to deliver strong, and sustainable, growth with low inflation;
- providing flexibility — with the right incentives to ensure we are getting the most out of time spent at work and other resources; and
- investing in capability — with well‑targeted investments in skills and human capital, public and private infrastructure and innovation.
In carrying out this agenda, managing the necessary transformation to a low carbon emissions economy in an economically responsible way will be particularly important for continued productivity growth. Moving quickly to put a price on carbon will be crucial in this regard.
Another priority is ensuring the timely and efficient implementation of existing initiatives such as the National Broadband Network and the remaining Seamless National Economy deregulation, competition and related reforms being undertaken with the states. These will build on investments being made in skills, infrastructure and innovation, and reforms in areas such as higher education.
Tax reform and infrastructure
The Government is ensuring that the benefits of the mining boom are made available to the broader community and are used to generate long‑run benefits. Implementation of the Minerals Resource Rent Tax provides the basis for cutting the company income tax rate, which will help broaden the benefits of the mining boom. By helping to meet the fiscal cost of improved superannuation arrangements (including a gradual increase in the superannuation guarantee rate from 9 to 12 per cent) and infrastructure investment in regional Australia (through the Regional Investment Fund), it also helps extend the benefits of the mining boom into the future.
Building on the initial response to the Australia's Future Tax System review, the Government will further improve the tax system by reforming poorly targeted concessions. In particular, the Government is removing the connection between the statutory value of car fringe benefits and kilometres travelled — addressing the perverse incentive to travel more, thereby contributing to environmental damage. The Government is also ending the poorly targeted Entrepreneurs Tax Offset. Instead it is helping all small businesses through simpler and more generous depreciation arrangements for motor vehicles and other assets, and reduced company income tax for small businesses operating as companies.
In this Budget the Government has also announced measures to improve the tax treatment of losses for designated infrastructure projects of national significance. Accessibility of tax losses will be maintained in the event of ownership changes and the value of accumulated losses will also be maintained over time. The operation of Infrastructure Australia will also be enhanced.
Responsive labour and education markets
Since well functioning education and training systems are a key means of increasing the supply of workers with appropriate skills, the Budget includes measures to reform current arrangements.
Current rigidities in the vocational education and training (VET) sector represent a critical medium‑ to long‑term failing in the flexibility of the labour and education markets (Box 6), and the system requires structural reform. To help meet longer term labour demands, particularly in service industries such as health care and social assistance, the Government is taking a new approach to VET to achieve higher quality and responsiveness.
The Government will establish a National Workforce Development Fund to invest in training projects for key sectors such as mining and construction and for priority occupations in partnership with industry. The new approach will improve the quality of training places delivered, and will help ensure the training meets the needs of industry. A more responsive training system will support employers, and improve the likelihood of students securing quality employment at the end of their course. The Fund will be managed by a National Workforce and Productivity Agency to work with industry to identify critical skill needs and develop sector skill plans, with a regional and training focus.
This Budget also includes measures to continue the modernising and reform of apprenticeships. These will provide for a better targeting of incentives, enhancements to competency based progression, mentoring support, and support for better training choices.
To help drive longer‑term reform of the training system, the Government will set new reform standards for its $7 billion over five years investment in the Skills and Workforce Development National Agreement. A review of the National Agreement by the Council of Australian Governments will allow the Commonwealth and States to partner in a strengthened training system. The Commonwealth will also offer $1.75 billion over five years (from 2012‑13) to states and territories who are prepared to partner with the Commonwealth on more ambitious reform for VET.
The Government will also make a modest increase to the 2011‑12 Migration Program — with an emphasis on attracting skilled migrants to live and work in regional areas. The Government will for the first time specify 16,000 places to the Regional Sponsored Migration Scheme and introduce Regional Migration Agreements to better meet location specific needs.
Box 6: Building responsive labour and education markets
Flexible labour markets require that relative wages can adjust to attract workers to areas of higher value; that information flows are effective so people are aware of employment opportunities; that they are free to change occupations, industries or regions in response to market signals; and that education and training markets are responsive to economic change. Well functioning education and training systems are the key means of increasing the supply of workers with appropriate skills.
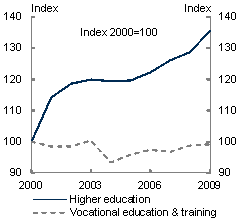
However, the publicly‑funded vocational education and training (VET) system has not responded to demand for VET qualifications over the past decade (Chart 25). Student numbers have been stagnating at around 1.7 million students per year. The Productivity Commission recently found clear deficiencies in the VET sector, including in meeting changing contemporary skills needs (Productivity Commission 2011). The Government's reforms to the VET sector are aimed at improving the quality of training and making the system more responsive to the needs of individuals and businesses (Statement 1). By contrast, despite inflexibilities of its own, the higher education sector has responded to demand for higher level qualifications, with student numbers increasing from around 600,000 in 2000 to around 800,000 in 2009. The Government's action to uncap student places from 2012 will allow universities to respond even more effectively.
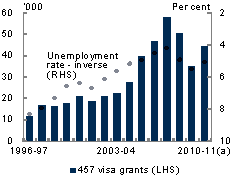
However, time lags in the acquisition of education and skills, both through training and then on‑the‑job experience, can be an obstacle to meeting short‑run demands. Appropriately targeted skilled migration assists in addressing these time lags. The Temporary Business Long Stay (subclass 457) visa program, which allows employers to access skilled workers not otherwise available to them in the domestic labour market, is highly responsive to the business cycle.
Chart 25: Students in tertiary education and employer sponsored workers
Students in higher education and VET
457 visa grants
Source: DIAC, ABS 6202.0, DEEWR, National Centre for Vocational Education Research, and Treasury.
If www.budget.gov.au responds slowly or you are having trouble downloading a document, try one of the Budget Website Mirrors
Note: Where possible, Budget documents are available in HTML and for downloading in Portable Document Format(PDF). If you require further information on any of the tables or charts on this website, please contact The Treasury.