




Statement 6: Expenses and Net Capital Investment (Continued)
Appendix C: Additional Agency Statistics
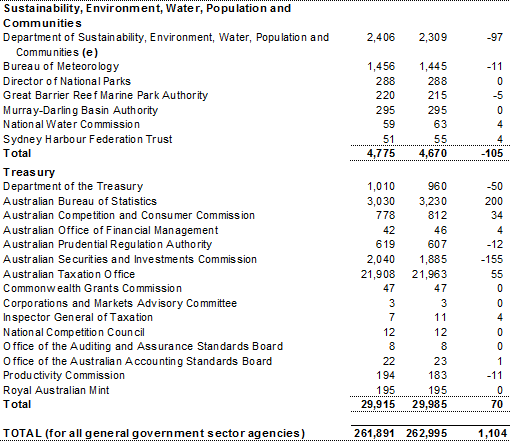
Table C1: General government expenses by agency
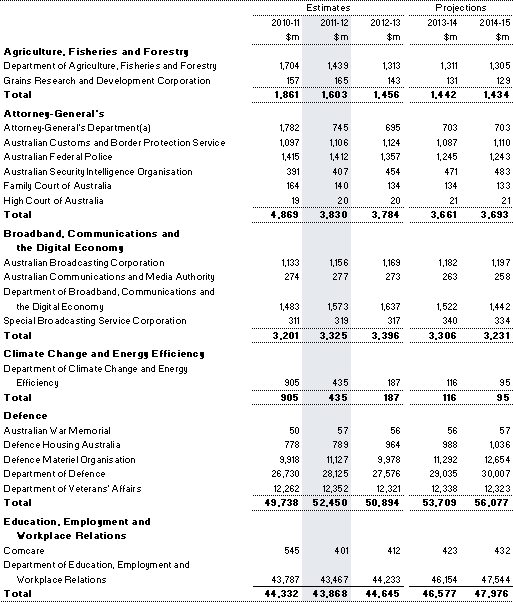
Table C1: General government expenses by agency (continued)
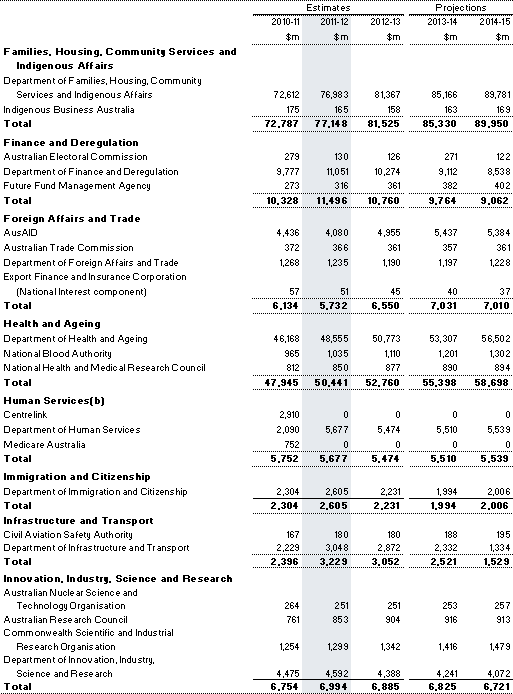
Table C1: General government expenses by agency (continued)
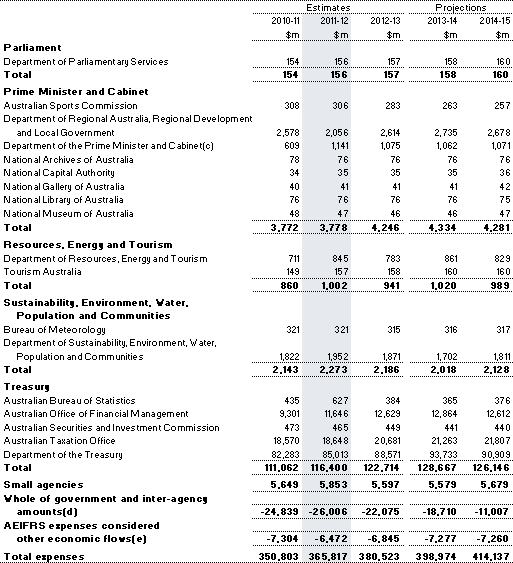
- Expenses in 2010‑11 include Australian Government Disaster Recovery Payments following the 2010‑11 summer floods and Tropical Cyclone Yasi.
- Estimates against Centrelink and Medicare Australia reflect their integration with the Department of Human Services from 2011‑12.
- Increased expenses in 2011‑12 reflect transfers of cultural heritage, arts and sports functions to the Department of the Prime Minister and Cabinet.
- Estimates of inter‑agency transactions are included in the whole of government and inter‑agency amounts. The entry for each portfolio does not include eliminations for inter‑agency transactions within that portfolio.
- Agency estimates are reported on an AEIFRS basis. AEIFRS expenses considered other economic flows include net write‑down and impairment of assets and fair value losses and swap interest expense as detailed in Statement 9 Note 13.
Table C2: Departmental expenses by agency
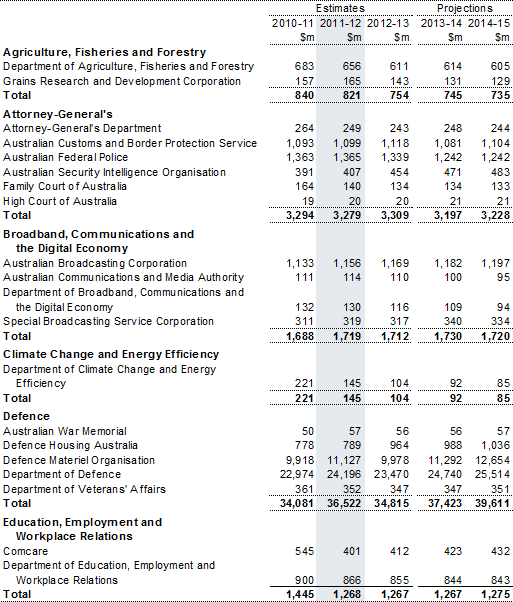
Table C2: Departmental expenses by agency (continued)
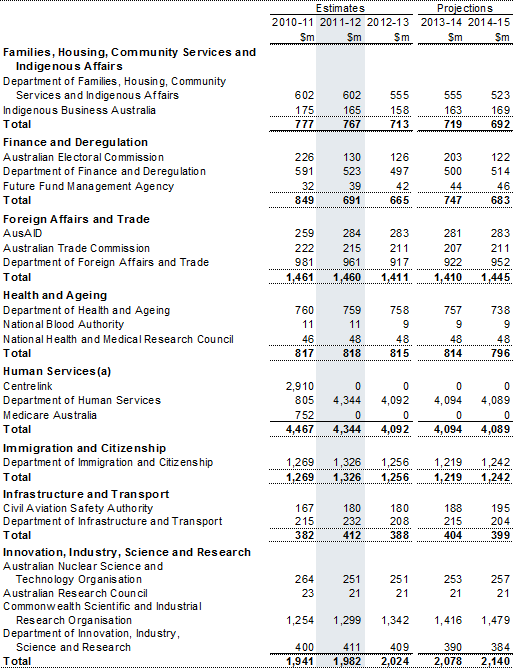
Table C2: Departmental expenses by agency (continued)
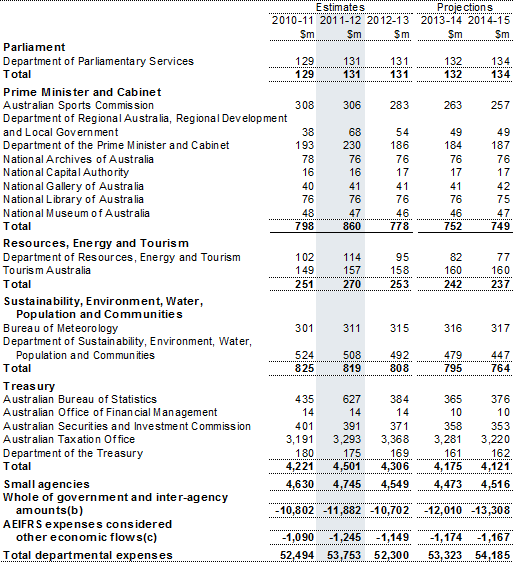
- Estimates against Centrelink and Medicare Australia reflect their integration with the Department of Human Services from 2011‑12.
- Estimates of inter‑agency transactions are included in the whole of government and inter‑agency amounts. The entry for each portfolio does not include eliminations for inter‑agency transactions within that portfolio.
- Agency estimates are reported on an AEIFRS basis. AEIFRS expenses considered other economic flows include net write‑down and impairment of assets and fair value losses.
Table C3: Net capital investment by agency
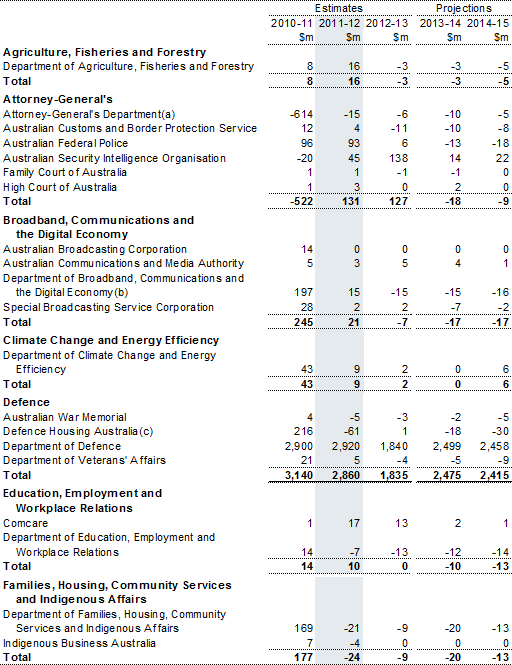
Table C3: Net capital investment by agency (continued)
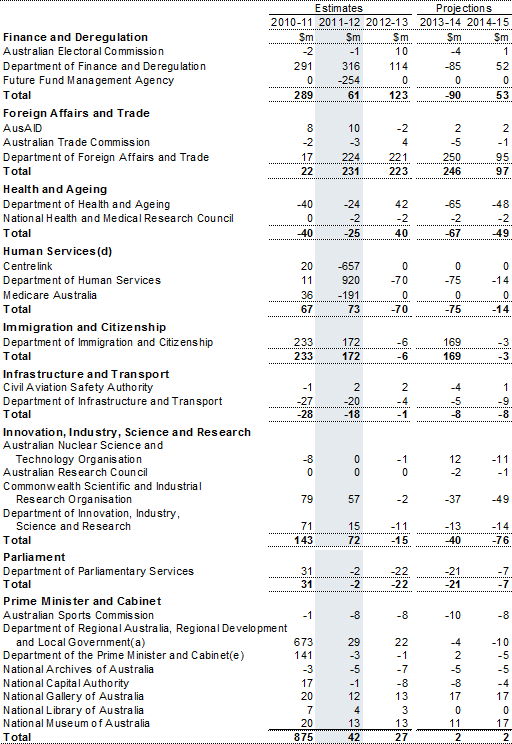
Table C3: Net capital investment by agency (continued)
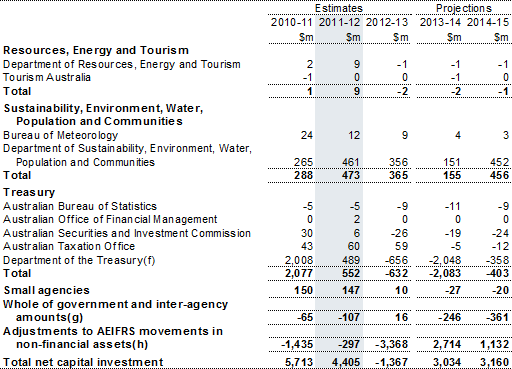
- Amounts in 2010‑11 reflect the movement of the territories function between agencies, with an accompanying transfer of physical assets. While this transfer affected the capital accounts of each agency, this transfer had no effect on the Commonwealth's overall asset position.
- The amount in 2010‑11 includes the construction and purchase of assets as part of the Regional Backbone Blackspots program.
- The amount in 2010‑11 includes new housing funded under the Nation Building program.
- Estimates against Centrelink and Medicare Australia in 2011‑12 represent the write down of assets and integration of the agencies into the Department of Human Services.
- Increased net capital investment in 2010‑11 reflects a movement of assets following the transfer of the cultural heritage, arts and sports functions to the Department of the Prime Minister and Cabinet.
- These amounts represent the effects of infrequently made pre‑payments to the States (for example. pre‑payments for flood assistance to the Queensland Government in 2010‑11 which will be unwound in 2013‑14).
- Estimates of inter‑agency transactions are included in the whole of government and inter‑agency amounts. The entry for each portfolio does not include eliminations for inter‑agency transactions within that portfolio.
- Agency estimates are reported on an AEIFRS basis. AEIFRS movements in non‑financial assets considered other economic flows include net write‑down and impairment of non‑financial assets, assets recognised for the first time and prepayments. They also include Contingency Reserve movements in non‑financial assets.
Table C4: Capital appropriations by portfolio
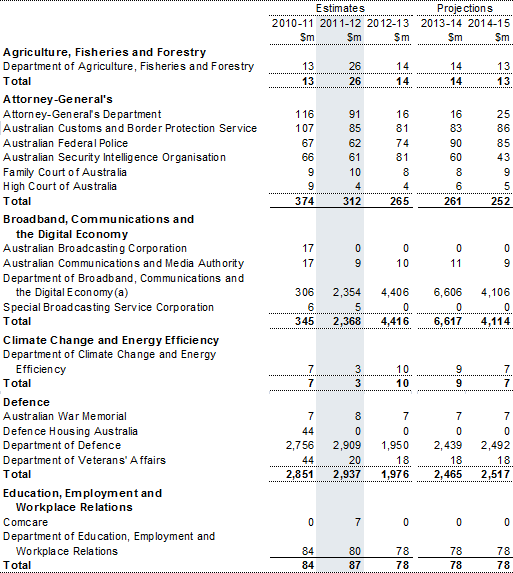
Table C4: Capital appropriations by portfolio (continued)
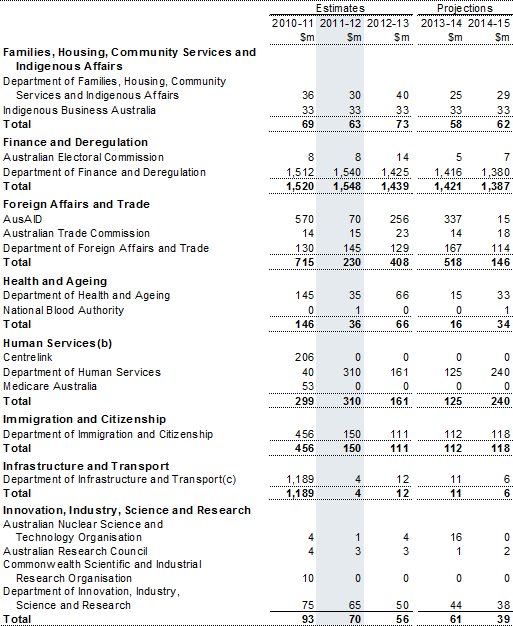
Table C4: Capital appropriations by portfolio (continued)
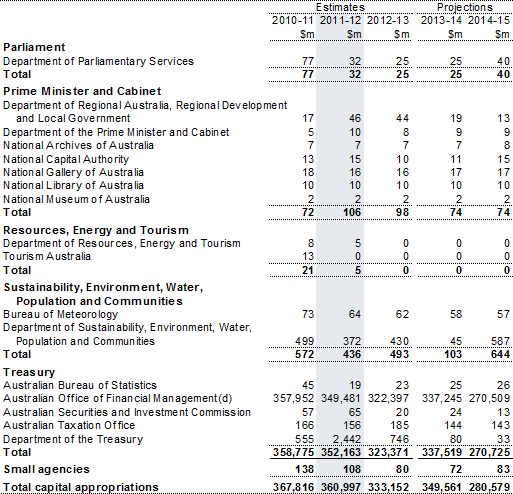
- Sharp rises in capital appropriations from 2011‑12 onward are due to capital injections for the National Broadband Network.
- Estimates against Centrelink and Medicare Australia reflect their integration with the Department of Human Services from 2011‑12.
- The amount in 2010‑11 reflects an equity injection into the Australian Rail Track Corporation.
- The AOFM manages the overall level of cash in the Official Public Account (OPA). It makes short‑term borrowings by issuing Treasury Notes and invests in short‑term deposits and securities to manage daily variations in the OPA balance. The capital appropriations include this short‑term investment and borrowing activity to manage the estimated within‑year profile of the OPA balance. As the within‑year profile of the OPA balance may differ from one year to the next, the estimates will reflect the size and timing of short term investment and borrowing activity.
Table C5: Estimates of average staffing level (ASL) of agencies in the
Australian Government general government sector(a)
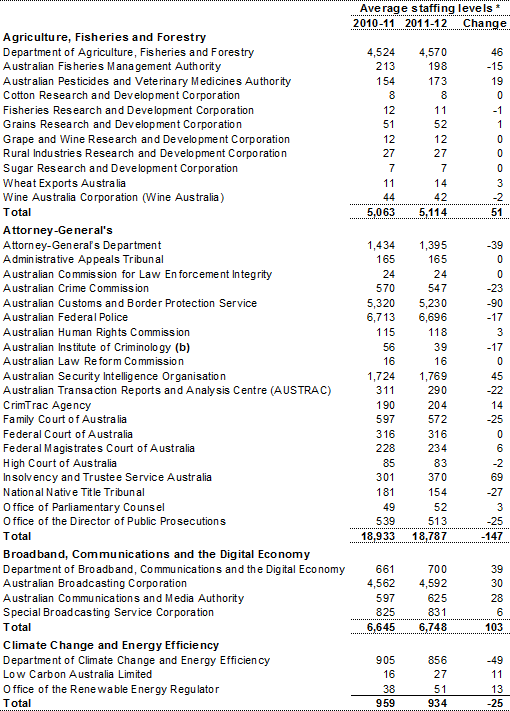
Table C5: Estimates of average staffing level (ASL) of agencies in the
Australian Government general government sector(a) (continued)
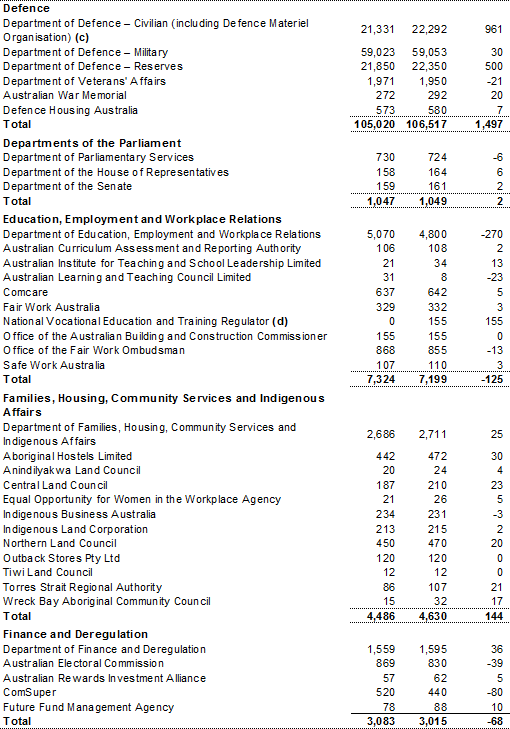
Table C5: Estimates of average staffing level (ASL) of agencies in the
Australian Government general government sector(a) (continued)
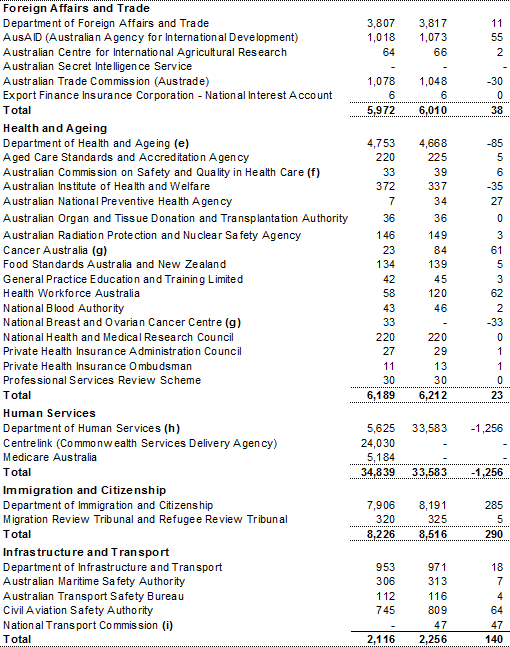
Table C5: Estimates of average staffing level (ASL) of agencies in the
Australian Government general government sector(a) (continued)
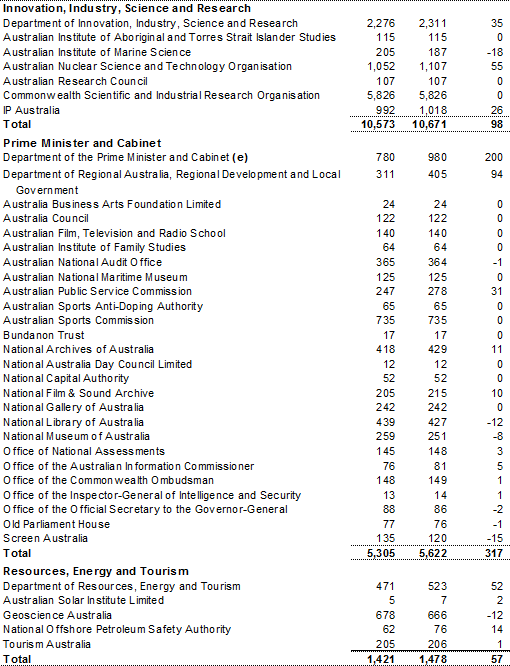
Table C5: Estimates of average staffing level (ASL) of agencies in the
Australian Government general government sector(a) (continued)
* Any discrepancies in totals are due to rounding of partial ASL
- This table includes estimates of ASL provided by general government sector agencies. ASL figures reflect the average number of employees receiving salary or wages over the financial year, with adjustments for casual and part time staff, to show the full‑time equivalent. This also includes non‑uniformed staff and overseas personnel.
- All administrative functions for the Criminology Research Council are undertaken by the Australian Institute of Criminology.
- The Department of Defence — Civilian includes the ASL for the Defence Materiel Organisation.
- The National Vocational Education and Training Regulator will commence on 1 July 2011.
- The increase in ASL for the Department of the Prime Minister and Cabinet (PM&C) between 2010‑11 and 2011‑12 largely reflects the arts and sports functions being in PM&C for only part of 2010‑11, but having a full‑year impact in 2011‑12. Corresponding reductions in ASL have occurred in the Department of Sustainability, Environment, Water, Population and Communities (for the arts function) and the Department of Health and Ageing (for the sports function) over the same period.
- The Australian Commission on Safety and Quality in Health Care will commence operations as a separate legal entity from 1 July 2011. The 2010‑11 comparative ASL relates to the estimated ASL for its current operation as a special account within the Department of Health and Ageing.
- Due to the merger of Cancer Australia and the National Breast and Ovarian Cancer Centre in 2011‑12, the ASL count is shown against Cancer Australia.
- As of the 2011‑12 financial year, Centrelink and Medicare Australia will cease to be independent agencies and instead will join the Department of Human Services. The projected difference between 2010‑11 and 2011‑12 ASL estimates for the Centrelink component of DHS is ‑1,016 ASL. The projected change for the Medicare Australia component of DHS is ‑102 ASL. The projected change for DHS excluding the former Centrelink and Medicare Australia components is ‑138 ASL.
- The National Transport Commission will be reported as a General Government Sector agency for the first time in 2011‑12, therefore previous years ASL figures have not been reported in this table. For comparative purposes, the Commission had the equivalent of 48 ASL in 2010‑11.
If www.budget.gov.au responds slowly or you are having trouble downloading a document, try one of the Budget Website Mirrors
Note: Where possible, Budget documents are available in HTML and for downloading in Portable Document Format(PDF). If you require further information on any of the tables or charts on this website, please contact The Treasury.