




Table A.6: Estimated payments to support state infrastructure services, by year and State
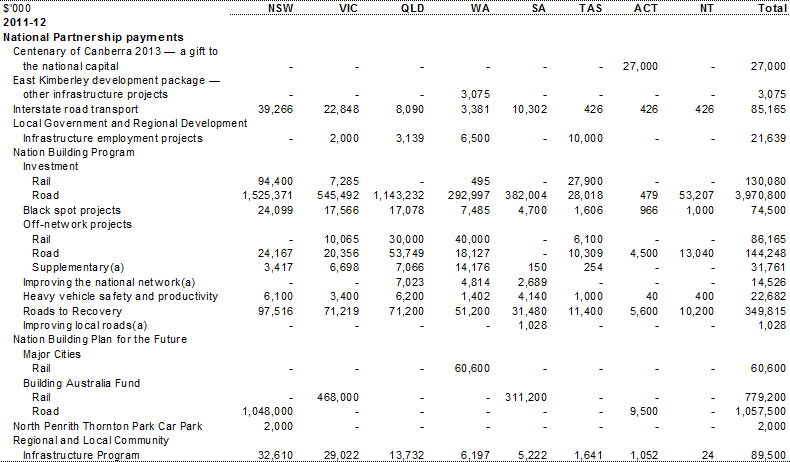
Table A.6: Estimated payments to support state infrastructure services, by year and State (continued)
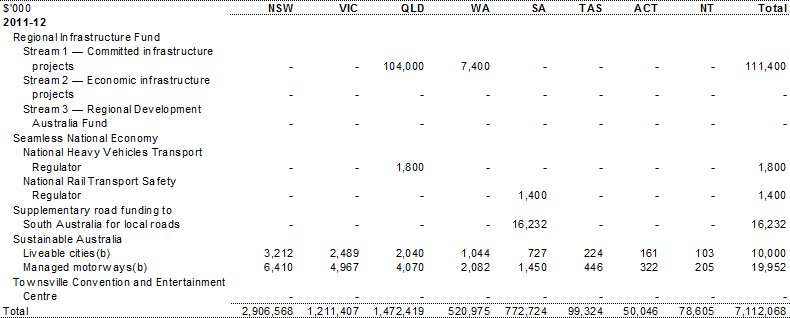
Table A.6: Estimated payments to support state infrastructure services, by year and State (continued)
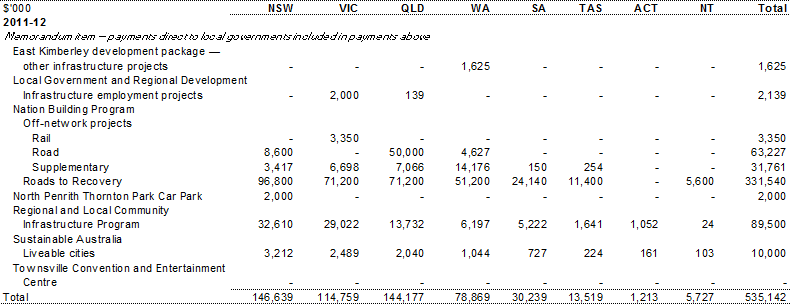
- Figures represent expenses incurred against prepayments made to the States in prior years.
- Yearly profiles and State splits are indicative distributions only and have been allocated on an equal per capita basis to all States.
Table A.6: Estimated payments to support state infrastructure services, by year and State (continued)
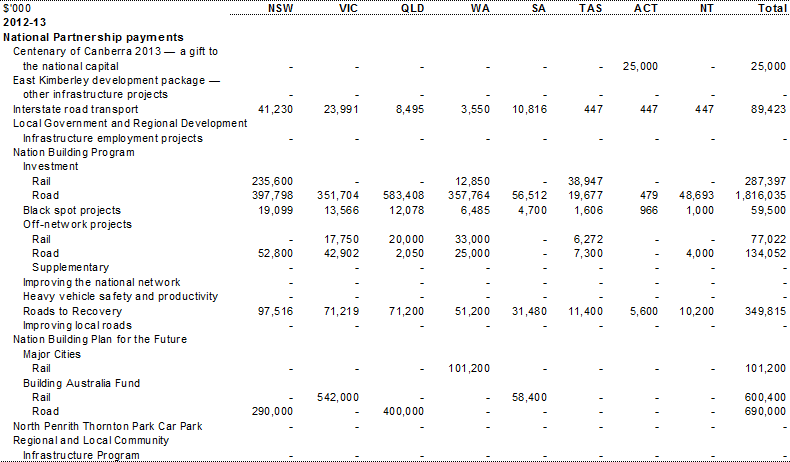
Table A.6: Estimated payments to support state infrastructure services, by year and State (continued)
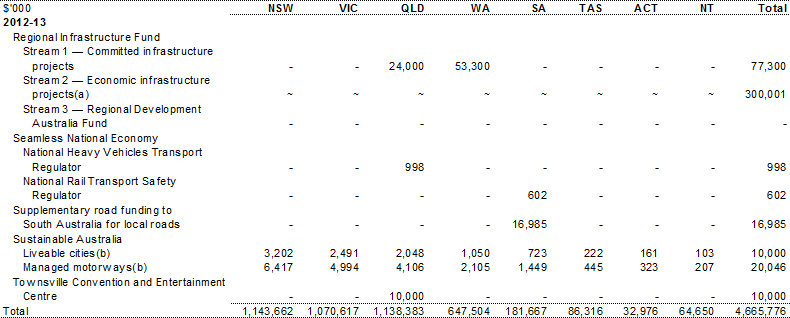
Table A.6: Estimated payments to support state infrastructure services, by year and State (continued)
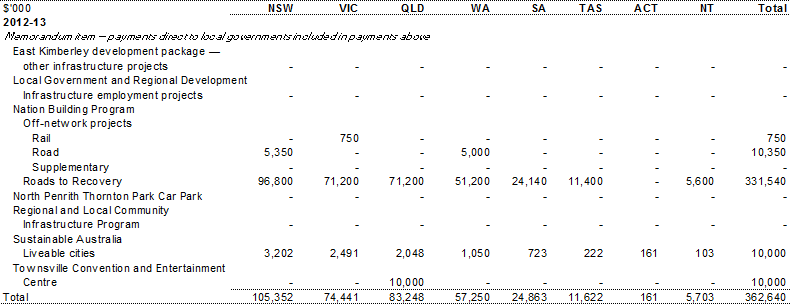
- State allocations for this stream are yet to be finalised.
- Yearly profiles and State splits are indicative distributions only and have been allocated on an equal per capita basis to all States.
Table A.6: Estimated payments to support state infrastructure services, by year and State (continued)
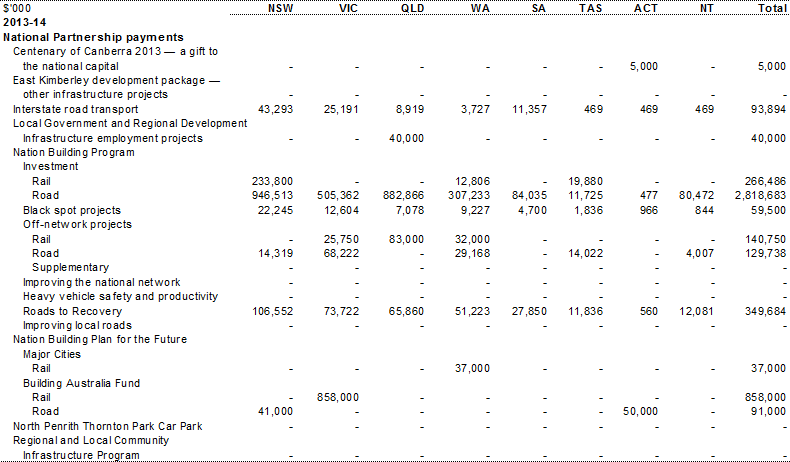
Table A.6 Estimated payments to support state infrastructure services, by year and State (continued)
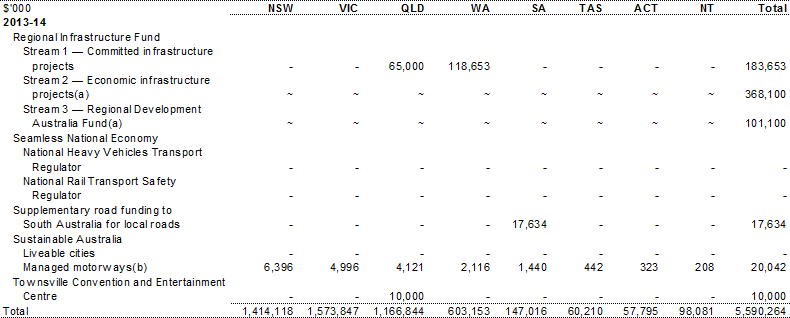
Table A.6 Estimated payments to support state infrastructure services, by year and State (continued)
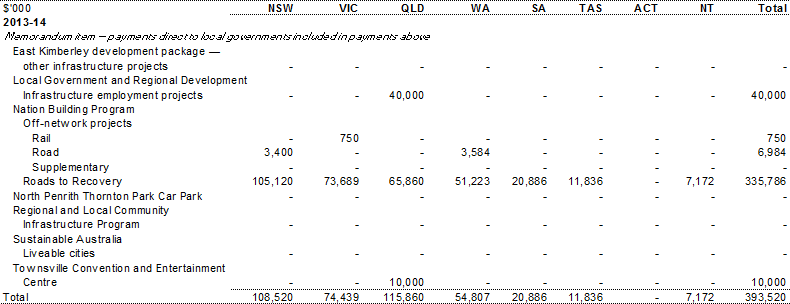
- State allocations for this stream are yet to be finalised.
- Yearly profiles and State splits are indicative distributions only and have been allocated on an equal per capita basis to all States.
Table A.6 Estimated payments to support state infrastructure services, by year and State (continued)
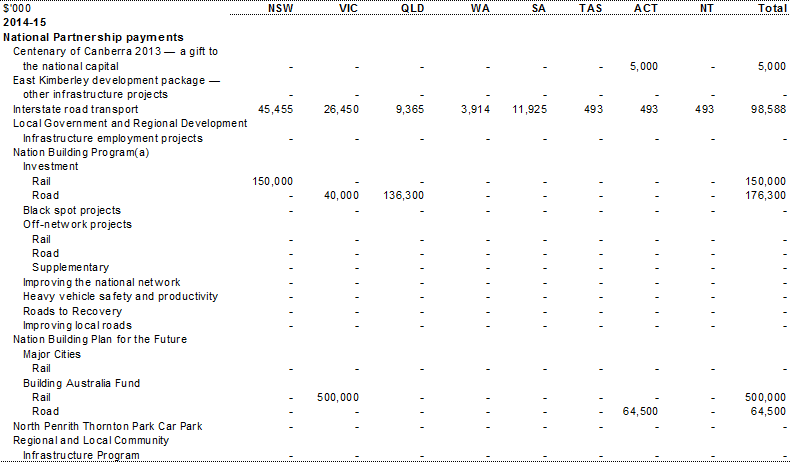
Table A.6 Estimated payments to support state infrastructure services, by year and State (continued)
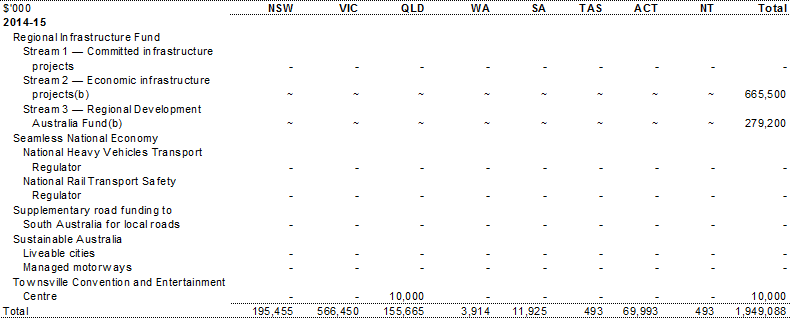
Table A.6 Estimated payments to support state infrastructure services, by year and State (continued)
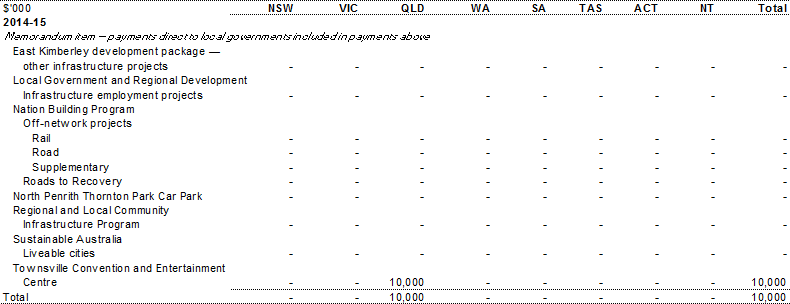
- Nation Building Program 2 will commence in 2014‑15. Provision for this has been made in the contingency reserve.
- State allocations for this stream are yet to be finalised.
If www.budget.gov.au responds slowly or you are having trouble downloading a document, try one of the Budget Website Mirrors
Note: Where possible, Budget documents are available in HTML and for downloading in Portable Document Format(PDF). If you require further information on any of the tables or charts on this website, please contact The Treasury.