




Statement 3: Fiscal Strategy and Outlook (Continued)
Fiscal outlook
An underlying cash surplus of $1.5 billion (0.1 per cent of GDP) is expected in 2012‑13, largely unchanged from the estimate at MYEFO. In accrual terms, a fiscal surplus of $2.5 billion (0.2 per cent of GDP) is expected for 2012‑13.
Table 4: Australian Government general government sector budget aggregates
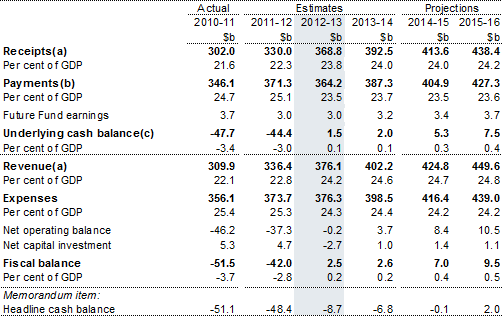
(a) Includes expected Future Fund earnings.
(b) Equivalent to cash payments for operating activities, purchases of non‑financial assets and net acquisition of assets under finance leases.
(c) Excludes expected Future Fund earnings.
Underlying cash balance estimates
The increase in the estimated 2011‑12 underlying cash deficit since MYEFO is largely a result of changes in economic circumstances reducing tax receipts, as well as new policy decisions that have increased payments including the Schoolkids Bonus and the bring forward of payments for local government services.
A small underlying cash surplus of $1.5 billion is expected in 2012‑13. The downward revision to total parameter and other variations of just under $2.9 billion since MYEFO has been offset by policy decisions of just over $2.9 billion.
Table 5 provides a reconciliation of the variations in the underlying cash balance since the 2011‑12 Budget.
Table 5: Reconciliation of underlying cash balance estimates
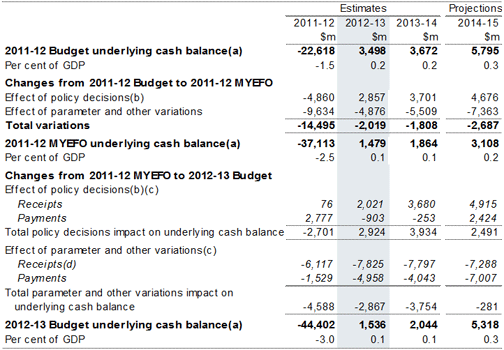
(a) Excludes expected Future Fund earnings.
(b) Excludes secondary impacts on public debt interest of policy decisions and offsets from the contingency reserve for decisions taken.
(c) A positive number for receipts indicates an increase in the underlying cash balance, while a positive number for payments indicates a decrease in the underlying cash balance.
(d) Receipts will differ from the cash receipts reconciliation published in Budget Statement 5 because they exclude Future Fund earnings.
Receipt estimates
Since MYEFO, receipts have been revised down by $6.1 billion in 2011‑12 and $7.8 billion in 2012‑13, largely reflecting changes in economic circumstances.
This largely reflects a downward revision to tax receipts. Tax receipts (excluding GST) have declined by $3.8 billion in 2011‑12 and $4.6 billion in 2012‑13. The main downward revisions have been to company and superannuation taxes, principally reflecting high levels of investment‑related tax deductions with the mining sector, weak profitability outside the resources and resources‑related sectors, and sluggish asset prices.
New policy decisions have increased receipts by $76 million in 2011‑12 and $2.0 billion in 2012‑13. Around a third of these savings in 2012‑13 relate to decisions taken not to proceed with (or defer) some previously announced tax measures that would otherwise have reduced tax receipts. The decisions in this Budget not to proceed with some measures will maintain tax liabilities at present levels.
Major policy decisions that have increased receipts from 2011‑12 to 2015‑16 include:
- not proceeding with lowering the company tax rate, which was due to commence from the 2013‑14 income year, nor the early start to lowering the company tax rate for small businesses, which was due to commence from 2012‑13. The Government was not able to secure the necessary Parliamentary support and for this reason the decision not to proceed with the company tax cut will now help fund initiatives to spread the benefits of the resources boom to help families on low and middle incomes and support business investment. This measure is expected to increase cash receipts by $4.6 billion over the five years to 2015‑16, which includes a reduction in receipts from the unwinding of the associated growth dividend;
- not proceeding with the standard deduction for work‑related expenses and the cost of managing tax affairs, which was scheduled to commence on 1 July 2013, as the Government is pursuing other simplification measures, such as trebling the tax free threshold. This will increase cash receipts by $1.6 billion over the four years to 2015‑16;
- deferring the higher concessional contribution caps for individuals over 50 with superannuation balances below $500,000 to 1 July 2014, which was due to start on 1 July 2012, increasing cash receipts by $1.4 billion over the four years to 2015‑16;
- increasing cash receipts by $1.1 billion over the four years to 2015‑16 by providing $106 million over four years to the Australian Taxation Office (ATO) to increase the ATO's collections of outstanding taxation debts and superannuation guarantee charges. This has no impact in fiscal balance terms;
- further reform to the fringe benefits tax concessions for living‑away‑from‑home allowances and benefits by limiting access to the concessions. This measure increases cash receipts by $1.0 billion over the four years to 2015‑16;
- reducing the higher tax concession for superannuation contributions of very high income earners, increasing cash receipts by $1.0 billion over the four years to 2015‑16;
- extending the 2010‑11 Budget measure to fund additional GST compliance activities to promote voluntary compliance by a further two years, increasing cash receipts by $1.1 billion over the four years to 2015‑16; and
- not proceeding with the 50 per cent tax discount for interest income which was due to commence on 1 July 2013, saving $795 million over the four years to 2015‑16.
The impact of these policy decisions on receipts has been partially offset by a number of decisions that have reduced receipts, including:
- allowing companies to carry back tax losses so they receive a refund against tax previously paid, decreasing receipts by $700 million over the four years to 2015‑16; and
- increasing the Medicare levy low‑income thresholds to $19,404 for individuals and $32,743 for families for the 2011‑12 income year, with effect from 1 July 2011, with a cost to the budget of $85 million over the four years to 2015‑16.
The effect of the carbon price on the budget is outlined in Box 1.
Box 1: Effect of the carbon price on the budget
The Carbon Pricing Mechanism will commence from 1 July 2012, with a fixed price period of three years (commencing at $23 in 2012‑13). The 2012‑13 Budget includes for the first time carbon price estimates for the 2015‑16 projection year, when the scheme will transition to a flexible price and be linked to the international market. In the flexible price period, international carbon prices are expected to set the domestic carbon price.
The Carbon Pricing Mechanism is expected to raise $24.7 billion in receipts over the forward estimates. The receipt estimates incorporate a carbon price for 2015‑16 of $29, based on Treasury modelling in Strong Growth, Low Pollution. Budget projection year parameters generally rely on longer‑term factors such as those captured in the Strong Growth, Low Pollution modelling.
Over the four years to July 2011, daily international carbon prices traded in the range of $14 to $50. Trading in the futures markets, however, is thin and sporadic for contracts as far out as 2015. More recently, traded international prices have fallen, in part due to the downturn in Europe. The unsettled global economic outlook is contributing to uncertainty around the future path of carbon prices.
Potential policy and regulatory change, particularly in the European Union Emissions Trading Scheme (EU ETS), has added to uncertainty around future carbon prices at this time. The EU recently brought forward a scheduled report on their scheme to 2012, which is now expected in coming months. Following this, the EU may consider policy options to increase the current low prices in the EU ETS, with implications for international carbon prices.
These circumstances indicate that the most suitable long‑run carbon price projection remains the Treasury projections in Strong Growth, Low Pollution.
Any change in international carbon prices would have an impact on the estimates of the Clean Energy Future package included in the Budget. As well as affecting carbon price receipts, a different carbon price would also affect the cost of assistance provided under the Clean Energy Future package. Assistance under the Jobs and Competitiveness Program and permit‑based assistance under the Energy Security Fund will move in line with the carbon price. Household assistance is permanent and will not be reduced.
To the extent that the carbon price is different than that modelled, it will have a different impact on consumer prices. For example, a lower carbon price would lead to a lower impact on consumer prices which would benefit households given the Government's household assistance package remains fixed.
While forward auctions of carbon permits will be conducted in 2013‑14 and 2014‑15, changes in the international carbon price parameter would have only a small impact on total budget revenues in those years. In 2015‑16, the budget would be firmly in surplus even if the price floor of $15 were to bind.
Payment estimates
Since MYEFO, total cash payments for 2012‑13 have decreased by $5.9 billion, comprised of new policy decisions which have reduced payments by a net $903 million and parameter and other variations which have reduced payments by $5.0 billion.
Major policy decisions since MYEFO that have increased cash payments in 2012‑13 and over the four years to 2015‑16 include:
- spreading the benefits of the resources boom by: increasing the maximum rate of Family Tax Benefit Part A (FTB‑A) by $300 per annum for families with one child and $600 per annum for families with two or more children from 1 July 2013. For families receiving the base rate of FTB‑A, the increase will be $100 for families with one child and $200 for families with two or more children; and introducing a new supplement for eligible income support recipients to assist with cost of living pressures. These measures are expected to increase cash payments by $153 million in 2012‑13 ($2.9 billion over the four years to 2015‑16);
- continuing Australia's military contribution to international stabilisation in East Timor, in Afghanistan and the wider Middle East Area of Operations, and Solomon Islands. These measures are expected to increase payments by $1.0 billion in 2012‑13 ($1.4 billion over the four years to 2015‑16);
- replacing the Education Tax Refund with a new Schoolkids Bonus provided through the transfer system at a cost of $2.4 billion over five years to 2015‑16. This measure increases payments by $1.3 billion in 2011‑12 and reduces costs by $105 million in 2012‑13 because of differences in the timing of payments under the new arrangements;
- the first stage of a National Disability Insurance Scheme which will provide support to people with a significant and permanent disability in up to four launch locations around Australia from 2013‑14. This measure is expected to increase payments by $84 million in 2012‑13 ($1.0 billion over the four years to 2015‑16);
- funding for the Government's Aged Care Reform package, which includes initiatives to increase the number of home care services, funding to attract and retain staff and improve the quality of care for older Australians, and increase support to people with dementia. These measures are expected to increase payments by $55 million in 2012‑13 ($284 million over the four years to 2015‑16);
- support for a range of Dental Health measures including funding to alleviate pressure on public dental waiting lists, increasing the size and capacity of the dental workforce, and funding for national oral health promotion activities. These measures are expected to increase payments by $85 million in 2012‑13 ($515 million over four years to 2015‑16). This funding is partially offset by the decision not to proceed with the Commonwealth Dental Health Program (saving $94 million in 2012‑13 and $290 million over three years to 2014‑15); and
- funding to construct a new Commonwealth‑operated Post‑Entry Quarantine facility, commencing operations in 2015‑16, to replace existing facilities as leases expire. The funding will also cover maintenance of core biosecurity operations and continue progress on reforming Australia's biosecurity system. These measures are expected to increase payments by $67 million in 2012‑13 ($365 million over the four years to 2015‑16).
The impact of these policy decisions on payments has been partially offset by a number of decisions that have reduced cash payments, including:
- changing the eligibility for Parenting Payment from 1 January 2013 for all recipients who were receiving the payment prior to 1 July 2006 to align eligibility for all parents receiving parenting payments. This measure is expected to decrease payments by $97 million in 2012‑13 ($687 million over four years to 2015‑16);
- limiting eligibility for FTB‑A to young people under 18 years of age, or where a young person remains in secondary school, the end of the calendar year in which they turn 19. This change will focus payments in the family assistance system on families with children who are at school, while Youth Allowance will become the primary form of assistance to eligible young adults. This measure is expected to decrease cash payments by $25 million in 2012‑13 ($312 million over the four years to 2015‑16);
- restructuring apprenticeship incentive payments for existing workers in occupations not on the National Skills Needs List, by removing the $1,500 commencement payment and increasing the completion payment by $500, which is expected to save $60 million in 2012‑13 ($354 million over the four years to 2015‑16);
- improving the targeting of the Extended Medicare Safety Net to help manage Medicare expenditure whilst continuing to provide support for people with high out‑of‑pocket costs. This measure is expected to decrease cash payments by $8 million in 2012‑13 ($95 million over the four years to 2015‑16);
- deferring the commitment to spend 0.5 per cent of Gross National Income on Official Development Assistance by one year to 2016‑17 which is expected to decrease payments by $447 million in 2012‑13 ($2.9 billion over the four years to 2015‑16);
- deferring some Defence acquisitions, adjusting the Defence capital equipment program and delivering further operating efficiencies, while delivering priority 2009 White Paper capabilities. This is expected to reduce payments by $971 million in 2012‑13 ($5.5 billion over the four years to 2015‑16); and
- accelerating funding for Local Government Financial Assistance Grants to assist in the response to challenges arising from natural disasters in 2010‑11 and 2011‑12. This measure is expected to reduce payments by $1.1 billion in 2012‑13 and increase cash payments by the same amount in 2011‑12.
Further details of Government policy decisions are provided in Budget Paper No. 2, Budget Measures 2012‑13. The expense estimates provided in Budget Paper No. 2 are in accrual terms and may not align exactly with the underlying cash payments figures provided in this Statement.
Major increases in expected payments in 2012‑13, as a result of parameter and other variations since MYEFO, include:
- natural disaster relief payments to the States under the Natural Disaster Relief and Recovery Arrangements, which are expected to be $324 million higher in 2012‑13 largely reflecting increased costs and changed timing for the submission of State claims;
- Disability Support Pension (DSP) payments which are expected to be $353 million higher in 2012‑13 ($1.5 billion over the four years to 2015‑16) due to an increase in the estimated number of DSP recipients, partly offset by slightly lower than anticipated average pension rates;
- offshore asylum seeker management costs, which are expected to be $378 million higher in 2012‑13 ($1.3 billion over the four years to 2015‑16) due to increased estimates of expected costs for holding irregular maritime arrivals in detention;
- Medicare Services payments which are expected to be $232 million higher in 2012‑13 mainly reflecting the extension of the Chronic Disease Dental Scheme (CDDS) to 30 September 2012 as a result of the Senate disallowing the determination to close the program. The closure of the CDDS remains government policy;
- employee assistance payments which are expected to be $115 million higher in 2012‑13 ($469 million over four years to 2015‑16) mainly due to an increase in demand for the General Employee Entitlements and Redundancy Scheme. This scheme provides assistance to employees of bankrupt businesses who are owed certain employee entitlements; and
- Commonwealth Grants Scheme payments to universities which are expected to be $103 million higher in 2012‑13 ($993 million over the four years to 2015‑16) due to faster‑than‑expected growth in university enrolments following the Government's decision in 2009 to uncap enrolment numbers from 2012. The uncapping of enrolment numbers also affects tertiary student assistance payments which are expected to be $278 million higher in 2012‑13 ($1.2 billion over the four years to 2015‑16).
Major reductions in expected payments in 2012‑13 as a result of parameter and other variations since MYEFO include:
- GST payments to the States and Territories consistent with a reduction in GST receipts ($2.9 billion in 2012‑13 and $13.8 billion over the four years to 2015‑16);
- reprofiling infrastructure spending ($927 million in 2012‑13 and $957 million over four years to 2015‑16). This reflects the earlier‑than‑expected completion of some projects, reprofiling rail payments to the States and Territories to better align funding with the delivery of projects, and the slippage in the Regional Infrastructure Fund payments due to the need for comprehensive project evaluations;
- Income Support for Seniors payments which are expected to be $229 million lower in 2012‑13 ($1.2 billion over the four years to 2015‑16) because of lower than previously forecast growth in payment rates as a result of lower forecasts for indexation parameters than those expected at MYEFO;
- defence force superannuation benefits which are expected to be $130 million lower in 2012‑13 ($457 million over the four years to 2015‑16) due to lower exit rates and a higher proportion of benefits taken as a pension in place of a lump sum payment. These factors will lead to higher superannuation costs beyond the forward estimates for defence force personnel; and
- Income Support for Carers payments which are expected to be $56 million lower in 2012‑13 ($348 million over the four years to 2015‑16) due to a lower‑than‑projected number of recipients partially offset by an increase in average payment rates.
As a consequence of the weaker fiscal outlook in the near term, and lower interest rates, net interest payments have increased by $158 million in 2012‑13 but decreased by $1.1 billion over the four years to 2015‑16.
Consistent with previous budgets, the underlying cash balance has been improved by the regular draw down of the conservative bias allowance. Details of this draw down are provided in Appendix B of Statement 6, Expenses and Net Capital Investment.
Fiscal balance estimates
The fiscal surplus is expected to be $2.5 billion (0.2 per cent of GDP) in 2012‑13, a decrease of $2.2 billion since MYEFO.
Table 6 provides a reconciliation of the variations in the fiscal balance since the 2011‑12 Budget.
Table 6: Reconciliation of fiscal balance estimates
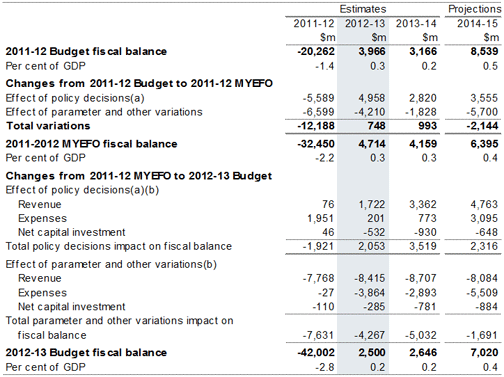
(a) Excludes secondary impacts on public debt interest of policy decisions and offsets from the contingency reserve for decisions taken.
(b) A positive number for revenue indicates an increase in the fiscal balance, while a positive number for expenses and net capital investment indicates a decrease in the fiscal balance.
Revenue estimates
Changes in revenue are generally driven by the same factors as receipts, though differences arise where revenue raised in a given year is not received in that year (see Appendix E of Statement 5, Revenue, for further information on the difference between accrual and cash estimates).
Expense estimates
Movements in accrual expenses over the forward estimates are broadly similar to the movements in cash payments. The key exceptions include:
- superannuation benefits where there are differences between timing of cash payments and accrued expenses; and
- the Natural Disaster Relief and Recovery Arrangements, where expenses are being recognised at a different time to cash payments.
More detailed information on expenses can be found in Statement 6, Expenses and Net Capital Investment.
Net capital investment estimates
Forecast net capital investment for 2011‑12 is largely unchanged since MYEFO.
In 2012‑13 net capital investment is forecast to be $816 million lower than forecast in MYEFO, largely reflecting adjustments in the Defence capital equipment program, including deferring some Defence acquisitions, and water purchases under the Restoring the Balance in the Murray‑Darling Basin program.
Fluctuations in the exchange rate since MYEFO have also resulted in the forecasts of net capital investment being reduced across the forward estimates.
More detailed information on net capital investment can be found in Statement 6.
Net debt, net financial worth and net worth
The further write down to tax receipts has contributed to higher estimated net debt, and lower net worth and net financial worth than was expected at MYEFO.
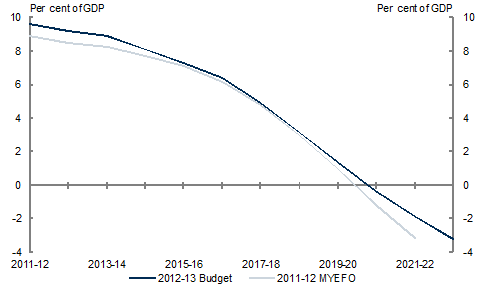
The Australian Government's net debt continues to remain very low by international standards. While the average net debt for major advanced economies is expected to peak at around 93 per cent of GDP in 2016 and 2017, Australia's net debt will peak at 9.6 per cent of GDP in 2011‑12. It is expected to reduce to 7.3 per cent of GDP by 2015‑16.
Net debt for the Australian Government general government sector is forecast to be $143.3 billion (9.2 per cent of GDP) in 2012‑13, $10.1 billion higher than forecast at MYEFO.
The change in the projected level of net debt in 2012‑13 since MYEFO is driven primarily by an increase in the value of the existing stock of Commonwealth Government Securities (CGS) on issue owing to lower interest rates. It also reflects an increase in issuance owing to the weaker fiscal outlook in 2011‑12, partially offset by an increase in the value of certain investments held by the Future Fund.
The changes to net debt described above also impact on net financial worth and net worth.
- Net financial worth is estimated to be ‑$248.6 billion in 2012‑13, compared to the MYEFO estimate of ‑$228.3 billion.
- Net worth is forecast to be ‑$137.8 billion in 2012‑13, compared to the MYEFO estimate of ‑$115.9 billion.
In addition to factors driving the change in the net debt position, the change in net financial worth and net worth also reflect the upward revaluation of the Australian Government's superannuation liability.
Further details on the balance sheet are outlined in Statement 7, Asset and Liability Management.
Table 7 provides a summary of Australian Government general government sector net financial worth, net worth, net debt and net interest payments.
Table 7: Australian Government general government sector net financial
worth, net worth, net debt and net interest payments
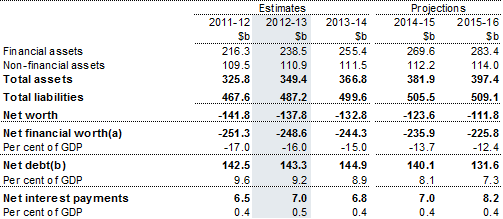
(a) Net financial worth equals total financial assets minus total liabilities.
(b) Net debt equals the sum of deposits held, government securities, loans and other borrowing, minus the sum of cash and deposits, advances paid, and investments, loans and placements.
CGS on issue subject to the current legislative limit is projected to be below $250 billion at the end of each financial year across the forward estimates. The volume of CGS on issue at various times throughout the year is projected to exceed this level due to within‑year fluctuations of CGS on issue. To manage most efficiently this normal within‑year financing task, and to ensure flexibility in meeting the Government's objective of maintaining a deep and liquid CGS market, an amendment will be sought to the Commonwealth Inscribed Stock Act 1911 to increase the legislative limit on CGS to $300 billion.
Medium‑term fiscal outlook
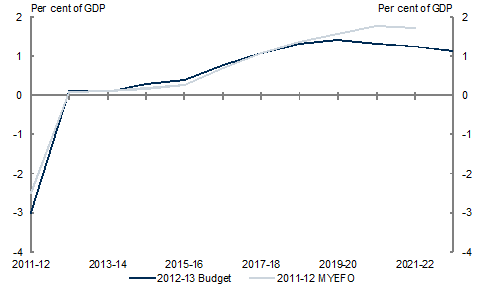
On current projections, the underlying cash surplus is expected to reach 1 per cent of GDP in 2017‑18, the same year as projected in MYEFO (Chart 1). Net debt is projected to return to zero in 2020‑21, also unchanged from MYEFO (Chart 2).
Towards the end of the medium term the projected surplus is slightly lower than expected at MYEFO. This reflects a downward revision to the projected participation rate which has flowed through to projections for GDP, tax receipts, and the surplus.
Chart 1: Underlying cash balance projected to 2022‑23
Source: Treasury projections.
Chart 2: Government net debt projected to 2022‑23
Source: Treasury projections.
If www.budget.gov.au responds slowly or you are having trouble downloading a document, try one of the Budget Website Mirrors
Note: Where possible, Budget documents are available in HTML and for downloading in Portable Document Format(PDF). If you require further information on any of the tables or charts on this website, please contact The Treasury.
