




Statement 6: Expenses and Net Capital Investment (Continued)
Overview (Continued)
General public services
Expenses under the general public services function support the organisation and operation of government such as those related to the Parliament, the Governor‑General and conduct of elections; the collection of taxes and management of public funds and debt; assistance to developing countries to reduce poverty and achieve sustainable development, particularly countries in the Pacific region; contributions to international organisations; and the operations of the foreign service. It also includes expenses related to research in areas not otherwise connected with a specific function, and those associated with overall economic and statistical services as well as government superannuation benefits (excluding nominal interest expenses on unfunded liabilities which are included under the nominal superannuation interest sub‑function in the other purposes function).
Table 4: Summary of expenses — general public services
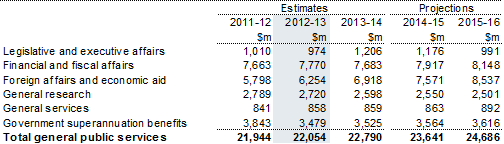
Total general public services expenses are estimated to increase in real terms by 3.9 per cent from 2012‑13 over the forward years, or 1.1 per cent per annum on average in real terms.
The uneven profile of expenses under the legislative and executive affairs sub‑function partly reflects costs that will be incurred by the Australian Electoral Commission to support the scheduled federal election in 2013‑14.
Expenses in the financial and fiscal affairs sub‑function are expected to increase over the forward estimates, primarily due to an increase in bad and doubtful debts expenses in line with the normal growth in taxation revenue over the forward estimates.
The increase in expenses from 2012‑13 over the forward years in the government superannuation benefits sub‑function reflects revised actuarial estimates of the Government's superannuation liability.
Total expenses under the foreign affairs and economic aid sub‑function are forecast to increase by 26.7 per cent in real terms from 2012‑13 over the forward years. This increase is due to the Government's commitment to increase the level of ODA to 0.5 per cent of Gross National Income by 2016‑17. While this represents a one year deferral of the original target of 2015‑16, ODA spending is still projected to continue to increase by 30.3 per cent in real terms from 2012‑13 to 2015‑16. Under the new growth profile, ODA spending will have doubled from 2007‑08 levels by 2014‑15. Based on current projections of ODA contributions by the 23 members of the Development Assistance Committee of the Organisation for Economic Co‑operation and Development (OECD), this growth path could see Australia rank sixth in the ODA donor rankings by 2015‑16. Currently, Australia is ranked tenth. Budget Paper No. 2, Budget Measures 2012‑13 contains further details on the Government's revision to the growth profile for ODA. Table 4.1 sets out the major components of foreign affairs and economic aid sub‑function expenses.
Table 4.1: Trends in the major components of foreign affairs and economic
aid sub‑function expenses
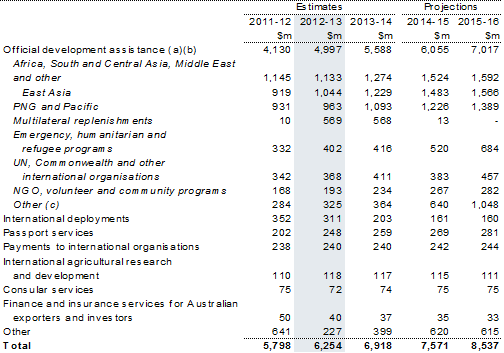
(a) The difference between these figures and the Government's ODA target is due primarily to the way replenishments are recognised in accrual terms when initial commitments are made. However, ODA targets are measured in cash terms and reflect the timing of actual cash payments (which, in the case of multilateral replenishments, can be spread over several years).
(b) Some minor ODA delivered by other government departments may be classified to other programs or functions.
(c) Other includes AusAID's departmental expenses and the provision available for future aid spending in the ODA Contingency Reserve (CR) in the Budget and forward estimates. The ODA CR represents the difference between the amount of ODA already committed by Australia and the Government's target levels of ODA.
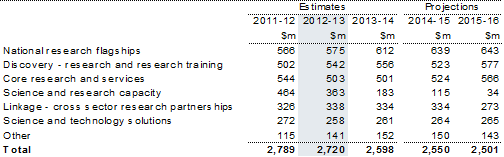
The general research sub‑function incorporates expenses incurred by the Commonwealth Scientific and Industrial Research Organisation, the Australian Nuclear Science and Technology Organisation, the Australian Institute of Marine Science and the Australian Research Council.
Total expenses in this sub‑function are forecast to decrease by 14.6 per cent in real terms from 2012‑13 over the forward years, or by 5.1 per cent per annum on average in real terms. This decrease is mainly due to the completion of a number of projects funded under the Education Investment Fund in the science and research capacity program.
The table below sets out the major components of general research sub‑function expenses.
Table 4.2: Trends in the major components of general research sub‑function
expenses
Defence
The defence function includes expenses incurred by the Department of Defence (Defence), the Defence Materiel Organisation (DMO) and other agencies. Defence expenses support Australian military operations overseas and the delivery of navy, army, air and intelligence capabilities and strategic policy advice in the defence of Australia and its national interests. The DMO contributes to the preparedness of the Australian defence organisation through the acquisition and through‑life support of military equipment and supplies.
This function records the majority of expenses incurred by the Defence portfolio but does not include the expenses incurred by the Department of Veterans' Affairs, superannuation payments to retired military personnel and housing assistance provided through Defence Housing Australia. These expenses are reported in the social security and welfare, other purposes, and housing and community amenities functions, respectively.
Table 5: Summary of expenses — defence

Total expenses for the defence function are estimated to increase by 5.0 per cent in real terms from 2012‑13 over the forward estimates, reflecting underlying growth after Defence's contribution to broader Government savings.
The forward estimates of expenses do not provide for extensions of currently approved operations beyond 2012‑13 (to the end of 2012 for East Timor). Such funding is considered on a year‑by‑year basis and is subject to future decisions of the Government. From 2012‑13, additional funding of $1.3 billion is being provided to support Defence overseas operations in Afghanistan, East Timor and the Solomon Islands. See Budget Paper No. 2, Budget Measures 2012‑13 for further details.
The Government will achieve savings in the Defence portfolio, including through deferring some Defence acquisitions, adjusting the Defence capital equipment program and delivering further operating efficiencies, while delivering priority 2009 Defence White Paper capabilities. These measures will result in savings of $5.5 billion over four years. These savings are in addition to the $20.6 billion in savings to be realised as part of the Defence Strategic Reform Program from 2009 through to 2020.
Further details on the capital reprogramming and additional efficiencies can be found in Budget Paper No. 2, Budget Measures 2012‑13.
The acquisition of defence capital items is reported in the net capital investment section of this Statement and in Box 3 below.
Box 3: Defence funding
Total Defence expenditure is estimated to decrease by $1.5 billion (8.6 per cent in real terms) in 2012‑13. This includes both expenses and net capital investment. Expenses for the defence function are those incurred in undertaking its day‑to‑day activities. Net capital investment represents expenditure to acquire capital items in the form of equipment, buildings and land, less depreciation expenses.
Table 5.1: Trends in the major components of defence function expenses
and net capital investment
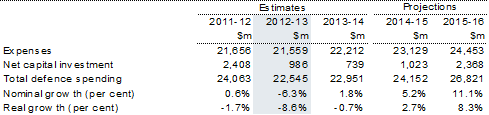
Capital spending in the defence function is for the acquisition of large and complex platforms and military equipment, and the construction of support facilities linked to capability. Capital spending can experience significant annual fluctuations, including as the result of slippage in expenditure from one year to the next year (or to later years), foreign exchange rate fluctuations, and in response to additional supplementary funding decisions of Government. Further details of defence capital spending are provided in the net capital investment section of this Statement.
The expected decrease in real Defence funding in 2012‑13 and 2013‑14 is due to adjustments in capital acquisitions, the practice of funding overseas operations on a year‑by‑year basis and the additional savings that take full effect in those years.
The Government will continue to support the priority capabilities of the 2009 Defence White Paper, including the Future Submarine Project and purchase of Joint Strike Fighters. The reprogramming of Defence funding and savings returned to the Budget will have no adverse affect on overseas operations or the provision of equipment to Defence Force personnel on or preparing for deployment on those operations. Military personnel numbers will not be affected by the realisation of additional savings from Defence. There will be a net reduction in civilian personnel numbers of 1,000, primarily through natural attrition and tightening of recruitment practices.
Public order and safety
Expenses under the public order and safety function support the administration of the federal legal system and the provision of legal services, including legal aid, to the community. Public order and safety expenses also include law enforcement and intelligence activities, and the protection of Australian Government property.
Table 6: Summary of expenses — public order and safety

Total expenses for the public order and safety function are estimated to decrease by 6.4 per cent in real terms from 2012‑13 over the forward years, or by 2.2 per cent per annum on average in real terms primarily through improved efficiencies.
Expenses within the courts and legal services sub‑function are expected to decrease by 5.9 per cent in real terms from 2012‑13 over the forward years, or by 2.0 per cent per annum on average in real terms. The reduction in funding from 2011‑12 to 2012‑13 mainly reflects the implementation of revised property management arrangements for the Commonwealth courts, which have transferred responsibility for some court property costs to the general public services function. The decrease in real terms from 2012‑13 over the forward years is largely due to increased efficiencies together with temporary funding ending in 2012‑13 for the Commonwealth Director of Public Prosecutions.
Expenses for the other public order and safety sub‑function are expected to decrease by 6.5 per cent in real terms from 2012‑13 over the forward years, or by 2.2 per cent per annum on average. These decreases result from efficiencies expected to be achieved in the delivery of security programs, including lower surveillance costs for the Australian Customs and Border Protection Service arising from the shared use of a Department of Defence vessel to patrol the Southern Ocean.
Education
The education function includes expenses to support the delivery of education services through higher education institutions; vocational education and training providers (including technical and further education institutions); and government (State and Territory) and non‑government primary and secondary schools.
Table 7: Summary of expenses — education
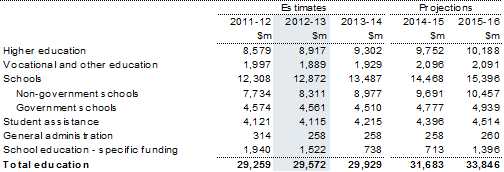
Total spending on education is expected to increase by 6.2 per cent in real terms from 2012‑13 over the forward years, or by 2.0 per cent per annum on average in real terms.
Expenses under the higher education sub‑function are estimated to increase by 6.0 per cent in real terms from 2012‑13 over the forward years. This primarily reflects the impact of reforms to higher education, including the introduction by the Government of a demand driven funding system and revised indexation arrangements.
As part of the transition to a demand driven funding system from 1 January 2012, the cap on Commonwealth funded over‑enrolments was increased from 5 to 10 per cent in 2010 and 2011. The cap on Commonwealth funded over‑enrolments was removed from 2012 onwards. The profile of higher education funding over the period 2012‑13 to 2015‑16 reflects the accumulated impact of the growth in actual enrolments from 2010, as well as forecast continued strong growth. More generous indexation arrangements for higher education funding, which now reflect movements in professional wages and salaries, will also contribute to increased funding for the sector.
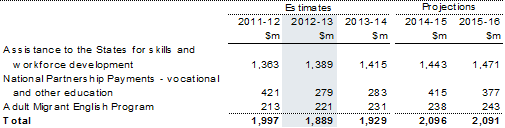
The component contributing most to the growth of the vocational and other education sub‑function is the Skills Reform National Partnership announced as part of the Building Australia's Future Workforce package in the 2011‑12 Budget. Total expenses for the sub‑function are estimated to increase by 2.8 per cent in annual average real terms from 2012‑13 over the forward years as a result of increased funding for this national partnership.
The major components of the vocational and other education sub‑function are set out in Table 7.1.
Table 7.1: Trends in the major components of vocational and other education
sub‑function expenses
Expenses under the schools — non‑government schools sub‑function are expected to increase by an average of 5.3 per cent per annum in real terms from 2012‑13 over the forward years. Strong growth in non‑government school expenses is due to the level of indexation applied to schools funding together with student enrolment growth. The indexation of schools funding is calculated based on average government school recurrent costs and is well above the Consumer Price Index.
Expenses under the schools — government schools sub‑function includes general assistance and national partnerships which, by their nature, are time limited. Excluding national partnerships, assistance to the States and Territories for government schools is estimated to increase from $3.6 billion in 2012‑13 to $4.2 billion in 2015‑16, an average increase of 4.6 per cent per annum in real terms over the forward estimates. The Smarter Schools national partnerships are progressively concluding over the next four years. A break‑up of national partnership funding can be found in Budget Paper No. 3, Australia's Federal Relations 2012‑13.
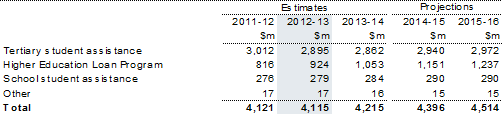
Expenses under the student assistance sub‑function are expected to increase by 1.8 per cent in real terms from 2012‑13 over the forward estimates, or by 0.6 per cent per annum on average in real terms. This reflects a real increase in expenses under the Higher Education Loan Program (HELP) partially offset by a real decrease in expenses for tertiary student assistance.
The real decrease in tertiary student assistance between 2012‑13 and 2013‑14 reflects a reduction in expenses in Youth Allowance (Student) payments, which is primarily the result of the Supporting Families with Teenagers measure announced in the 2011‑12 Budget. From 1 January 2012, dependent 16 to 19 year olds in secondary full‑time study and dependent 16 to 17 year olds in non‑secondary full‑time study are no longer eligible for Youth Allowance (Student) and will instead be supported by Family Tax Benefit Part A, which is reported under the social security and welfare function.
The expenses for HELP reflect the estimated cost to the Government of providing concessional loans as well as the cost of providing incentives for students to pay university fees up‑front and to make early repayments on their HELP debts. The expected increase in HELP expenses reflects the introduction of a demand driven funding system, which will increase the number of students accessing a HELP loan.
The major components of the student assistance sub‑function are set out in Table 7.2.
Table 7.2: Trends in the major components of student assistance sub‑function
expenses
The major components of the school education — specific funding sub‑function are the national partnership agreements on Building the Education Revolution, Digital Education Revolution, Improving Teacher Quality, Trade Training Centres, Empowering Local Schools, Reward for School Improvement, Rewards for Great Teachers and Youth Attainment and Transitions, and a number of elements of the Closing the Gap package. This includes both government and non‑government school expenditure. The variation in expenses between years is predominantly attributed to the terms of these national partnerships. In particular, the estimated reduction in expenses from 2011‑12 to 2014‑15 is due to the winding up of a number of national partnerships including Youth Attainment and Transitions, Digital Education Revolution, Improving Teacher Quality and the completion of Building the Education Revolution projects by the end of 2011‑12. The increase in expenses from 2014‑15 to 2015‑16 is due to the rollout of new national partnerships including Empowering Local Schools, Reward for School Improvement and Rewards for Great Teachers.
Box 4: Education spending trends
The education function contains a number of significant programs with sustained strong expenditure growth. Average real expenditure growth in assistance to government and non‑government schools has been around 4 per cent and 5 per cent per annum respectively over the period 2000‑01 to 2010‑11, while the Higher Education Support program has seen growth of around 3 per cent per annum in real terms.
Indexation of assistance levels to both government and non‑government schools is based on average cost growth in government schools, which has averaged around 6 per cent per annum over the past 10 years, and which is expected to remain at this level over coming years. Population growth amongst 5 to 18 year olds over the next ten years is expected to be higher than over the past ten years. Average real expenditure growth for these programs is therefore expected to be a little higher than in the past, but remaining in the order of 4 to 5 per cent per annum.
Recent strong growth in student enrolments and more generous indexation arrangements have led to strong growth in Higher Education Support over the forward estimates. Beyond the forward estimates, student enrolment growth is not expected to continue at these enhanced levels and average real expenditure growth for the Higher Education Support program is likely to stabilise at around 3 per cent per annum.
The Final Report of the Review of Funding for Schooling Final Report (the Gonski Review), and the Government's initial response, were released on 20 February 2012. The Review makes a number of recommendations for school funding reform in Australia.
The Government's initial response to the Gonski Review acknowledged the need for more work to be done to validate and refine elements of the Review's recommendations. A total of $5.8 million over two years has been provided to the Department of Education, Employment and Workplace Relations to undertake this work.
If www.budget.gov.au responds slowly or you are having trouble downloading a document, try one of the Budget Website Mirrors
Note: Where possible, Budget documents are available in HTML and for downloading in Portable Document Format(PDF). If you require further information on any of the tables or charts on this website, please contact The Treasury.
