




Statement 6: Expenses and Net Capital Investment (Continued)
Overview (Continued)
General government net capital investment
Net capital investment is broadly defined as the sale and acquisition of non‑financial assets less depreciation expenses. It provides a measure of the overall growth in capital assets (including buildings and infrastructure, specialist military equipment, and computer software) after taking into account depreciation and amortisation as previously acquired assets age.
Australian Government general government sector net capital investment is expected to be negative $2.7 billion in 2012‑13, $7.5 billion lower than in 2011‑12. This change is largely due to a reduction in the acquisition of Defence assets, along with the sale of some non‑financial assets.
Table 18: Estimates of total net capital investment

Reconciliation of net capital investment since the 2011‑12 Budget
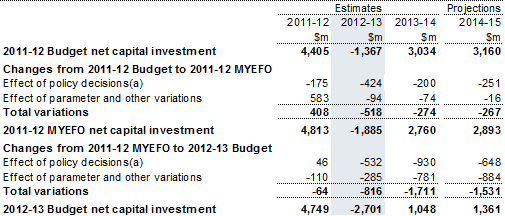
A reconciliation of the net capital investment estimates, showing the effect of policy decisions and parameter and other variations since the 2011‑12 Budget, is provided in Table 19.
Table 19: Reconciliation of net capital investment estimates
(a) Excludes secondary impacts on public debt interest of policy decisions and offsets from the Contingency Reserve for decisions taken.
The forecast net capital investment for 2012‑13 is largely unchanged since the 2011‑12 MYEFO.
A discussion of changes between the 2011‑12 MYEFO and the 2012‑13 Budget, shown in the table above, can be found in Statement 3. Further information on the capital measures since MYEFO can be found in Budget Paper No. 2, Budget Measures 2012‑13.
Net capital investment estimates by function
Estimates for Australian Government general government sector net capital investment by function for the period 2011‑12 to 2015‑16 are provided in Table 20.
Table 20: Estimates of net capital investment by function
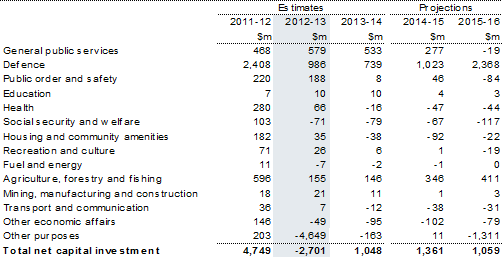
A significant component of the Government's net capital investment in 2012‑13 occurs in the defence function. These investments reflect the acquisition of military equipment and the construction of support facilities. Such investments can experience uneven expenditure throughout their development and life cycle extending over long periods of time, and can contribute to fluctuations in levels of net capital investment from year to year. Major factors contributing to changes in net capital investment, expected to occur in the following functions, include:
- defence — reprogramming funding over the forward estimates for the Defence capital investment program. The reprogramming reflects deferring some Defence acquisitions and adjusting the Defence capital equipment program, while delivering priority 2009 Defence White Paper capabilities;
- general public services — replacement of a research vessel for the Commonwealth Scientific and Industrial Research Organisation funded through the Education Investment Fund;
- public order and safety — the fit out of the central office accommodation for the Australian Security Intelligence Organisation and the replacement of existing Bay Class vessels and information communication technology hardware together with refurbishment and accommodation activities by the Australian Customs and Border Protection Service; and
- agriculture, forestry and fishing — investment in water entitlements under the Water for the Future package, to address water over‑allocation in the Murray‑Darling Basin, which is expected to decline in 2012‑13 and 2013‑14.
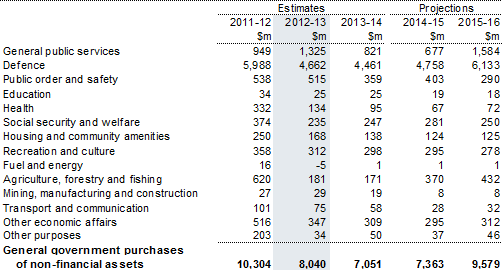
Table 21 reports the acquisition of non‑financial assets by function before taking into account depreciation or amortisation.
Table 21: Australian Government general government sector purchases of
non‑financial assets by function
Trends in Australian Government staffing
Trends in the estimated annual average staffing level (ASL)1 for all agencies in the General Government Sector are reported in Table 22 below. The data provides a summary of people employed by the Australian Government, including all Defence Force personnel and those employed by Statutory Authorities.
Table 22: Estimates of Average Staff Levels

The 2011‑12 Budget papers estimated 262,995 ASL in 2011‑12. The current estimate is 261,637 ASL in 2011‑12. The 2012‑13 Budget is expected to result in a reduction in ASL of 3,073 in 2012‑13 across the General Government Sector.
Appendix C provides details of ASL at the portfolio and agency level.
1 ASL figures reflect the average number of employees receiving salary or wages over the financial year, with adjustments for casual and part-time staff, to show the average full time equivalent (FTE). ASL figures also include non‑uniformed staff and overseas personnel.
If www.budget.gov.au responds slowly or you are having trouble downloading a document, try one of the Budget Website Mirrors
Note: Where possible, Budget documents are available in HTML and for downloading in Portable Document Format(PDF). If you require further information on any of the tables or charts on this website, please contact The Treasury.
