




Part 4: Developments in the Consolidated Non‑Financial Public Sector
The consolidated public sector fiscal position is expected to continue to improve following the effects of the global financial crisis (GFC). Expenses as a proportion of GDP are forecast to fall relative to historical averages, offsetting the effect of revenue as a proportion of GDP being below its pre‑GFC level.
The Commonwealth general government fiscal and cash balances are expected to be in surplus from 2012‑13. By 2014‑15, the Commonwealth position will be sufficient to offset the continuing (albeit narrowing) deficits at the aggregate State level, and result in consolidated fiscal and cash surpluses.
The effects of the patchwork economy are evident in the relative fiscal positions of the States, although State‑specific factors also play a role. Some States are anticipating surpluses sooner than others, with Victoria and Western Australia expecting operating surpluses in each of the forecast years.
Introduction
This Part provides perspective on the financial position of all levels of government in Australia.
It discusses trends in key fiscal indicators including the net operating balance, fiscal balance, cash balance, net debt and net interest payments, at the Commonwealth and State and local level, and at the consolidated level.
The Part focuses on trends in the non‑financial public sector (NFPS) which comprises the general government sector and the public non‑financial corporations (PNFC) sector. The general government sector provides non‑market goods and services such as policing, health and education. The PNFC sector comprises government‑controlled corporations engaged in providing market goods such as electricity and public transport, but not financial services.
For further information on the fiscal indicators and the institutional structure of the public sectors see Budget Paper No. 1, Statement 9.
The State estimates in this Part come from 2011‑12 mid‑year financial reports, with the exception of those for Victoria and the Northern Territory, which are drawn from 2012‑13 Budgets. Aggregate State data are only available to 2014‑15.
Additional data tables can be found in Appendix D.
Net operating balance
The net operating balance measures in accrual terms the gap between recurrent expenses and revenue for a given period. This is the headline budget measure used by most States to provide an indication of the medium‑term sustainability of the existing level of government services. The Commonwealth does not use net operating balance as a headline fiscal indicator.
In aggregate, the States are estimating general government sector operating deficits in 2012‑13, improving to operating surpluses by 2014‑15. The circumstances in individual States vary.
Victoria and Western Australia are estimating operating surpluses in 2012‑13 and each of their forecast years.
All other States are expecting operating deficits in 2012‑13, with Queensland and South Australia expecting to reach operating surpluses by 2014‑15.
In aggregate, the States are not expecting own‑source taxation revenue as a proportion of GDP to return to pre‑GFC levels prior to 2014‑15. States are also forecasting a decline in their non‑tax revenue (as a proportion of GDP).
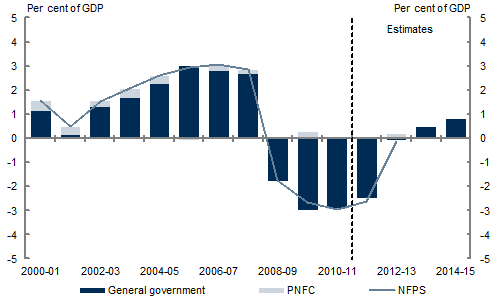
Chart 4.1: Consolidated net operating balance by sector(a)
(a) Data for the PNFC sector (and therefore NFPS) are not available beyond 2012‑13.
The expected return by the States, in aggregate, to operating surplus by 2014‑15 reflects that the States are forecasting expenses as a proportion of GDP to be below the pre‑GFC 10‑year average across the forward estimates, but particularly in 2013‑14 and 2014‑15.
As shown in Chart 4.1, the consolidated general government net operating position is estimated to be in deficit in 2012‑13, strengthening to a surplus of 0.8 per cent of GDP in 2014‑15.
Fiscal and cash balances
A fiscal surplus indicates that a government is saving more than enough to finance all of its investment spending and is therefore not contributing directly to the current account deficit. A fiscal deficit indicates that a government needs to borrow or liquidate financial assets in order to fund its capital and/or recurrent expenditures.
As the fiscal balance includes capital transfers and investment in non‑financial assets, which are not included in the net operating balance, the difference between the fiscal balance and the net operating balance is the effect of investment in infrastructure.
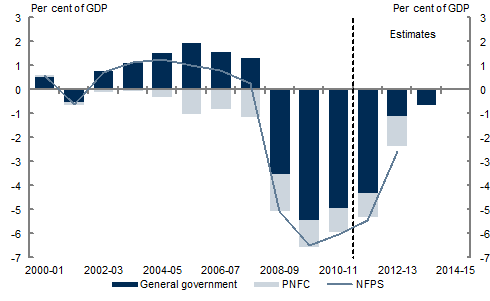
Chart 4.2: Consolidated fiscal balance by sector(a)
(a) Data for the PNFC sector (and therefore the NFPS) are not available beyond 2012‑13.
The fiscal balances of both the Commonwealth and State/local general government sectors are expected to improve over the forward years. While the Commonwealth general government sector is expected to return to fiscal surplus in 2012‑13, aggregate State deficits delay the return to surplus at the consolidated level until 2014‑15.
Aggregate State net capital investment is forecast to decline over the forward estimates period, reaching 0.2 per cent of GDP by 2014‑15. This is considerably less than pre‑GFC investment levels, which averaged 0.4 per cent of GDP in the 10 years to 2007‑08. The reduction in net capital investment and the improving net operating position are driving an improvement in the aggregate State fiscal position across the forward estimates period.
As shown in Chart 4.2, the consolidated general government sector fiscal balance is expected to be a deficit of 4.3 per cent of GDP in 2011‑12 and 1.1 per cent of GDP in 2012‑13. Fiscal deficits are also expected in the PNFC sector, leading to an NFPS deficit of 5.5 per cent of GDP in 2011‑12 and 2.6 per cent of GDP in 2012‑13.
The cash balance is the equivalent of a fiscal balance measured on a non‑accrual basis, that is, capturing payments and receipts as they occur. It therefore reflects the extent to which cash is available to a government.
The same trends as discussed above in relation to the fiscal balance are affecting the cash balance of both the Commonwealth and State governments.
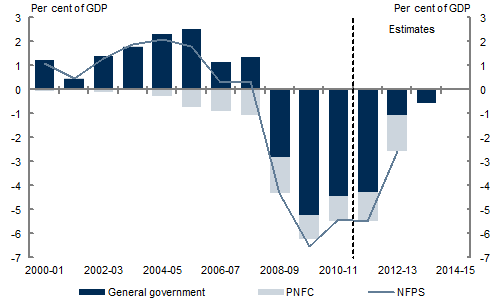
As shown in Chart 4.3, the consolidated general government sector cash balance is expected to be a deficit of 4.3 per cent of GDP in 2011‑12 and 1.1 per cent of GDP in 2012‑13. Cash deficits are also expected in the PNFC sector, leading to an NFPS deficit of 5.5 per cent of GDP in 2011‑12 and 2.6 per cent of GDP in 2012‑13.
Chart 4.3: Consolidated cash balance by sector(a)
(a) Data for the PNFC sector (and therefore the NFPS) are not available beyond 2012‑13.
Net debt
Net debt is the sum of selected financial liabilities (deposits held, advances received, government securities, loans and other borrowing) less the sum of selected financial assets (cash and deposits, advances paid, investments, loans and placements). Net debt does not include superannuation‑related liabilities.
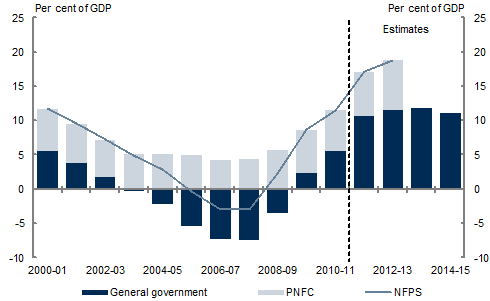
Consolidated general government sector net debt is expected to be 11.6 per cent of GDP in 2012‑13.
General government sector net debt as a proportion of GDP for the Commonwealth is forecast to peak in 2011‑12, and decline over the forward years as the fiscal surpluses from 2012‑13 onwards allow the repayment of debt. State net debt as a proportion of GDP is expected to increase through to 2013‑14, and decline marginally in 2014‑15, reflecting the aggregate net fiscal deficits of the States.
Commonwealth net debt is expected to continue to make up the bulk of consolidated net debt, although the States' aggregate share is expected to increase over the forward estimates.
As shown in Chart 4.4, consolidated NFPS net debt is expected to be 18.9 per cent of GDP in 2012‑13.
Chart 4.4: Consolidated net debt by sector
(as at end of financial year)(a)
(a) Data for the PNFC sector (and therefore the NFPS) are not available beyond 2012‑13.
Net interest payments
Net interest payments reflect the cost of servicing debt. The higher the net debt of a government, the greater the call that will be imposed on that government's future revenue flows to service the debt.
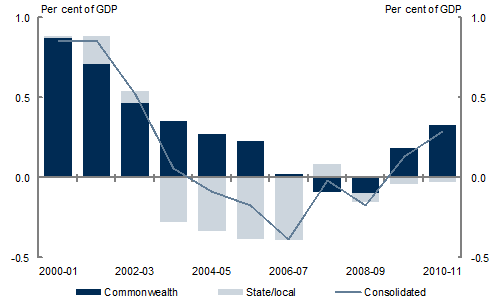
Consolidated general government sector net interest payments reached a low in 2006‑07, as the Commonwealth and State/local general government sectors recorded sustained budget surpluses, which were used, in part, to pay down debt.
Budget deficits and rising net debt associated with the global slowdown have caused net interest payments to rise. In 2010‑11, consolidated general government sector net interest payments rose by 0.2 percentage points of GDP.
Chart 4.5: General government sector net interest payments
The Australian Loan Council
The Australian Loan Council is a Commonwealth‑State standing council that coordinates public sector borrowing. It consists of the Prime Minister of Australia and the Premier/Chief Minister of each State and Territory. In practice, each member is represented by a nominee, usually the Treasurer of that jurisdiction, with the Commonwealth Treasurer as Chair.
Current Loan Council arrangements operate on a voluntary basis and emphasise transparency of public sector financing rather than adherence to strict borrowing limits. These arrangements are designed to enhance financial market scrutiny of public sector borrowing and facilitate informed judgments about each government's financial performance.
The Loan Council traditionally meets annually around March or April to consider jurisdictions' nominated borrowings for the forthcoming year. As part of the agreed arrangements, the Loan Council considers these nominations, having regard to each jurisdiction's fiscal position and the macroeconomic implications of the aggregate figure.
Since 2009‑10, the role of the Loan Council has included reporting on the macroeconomic implications of proposed expenditure from the Building Australia Fund, the Health and Hospitals Fund and the Education Investment Fund.
The Loan Council has also provided an additional level of scrutiny regarding the use of the Guarantee of State and Territory Borrowing (the Guarantee) introduced during the GFC and which closed to new issuance on 31 December 2010.
Outcome of the 2012 Loan Council meeting
The Loan Council met on 4 April 2012 to consider Loan Council Allocation nominations for 2012‑13. The Loan Council approved each jurisdiction's nominated allocation. In aggregate, the nominations represent a deficit of $38.7 billion (Table 4.1). The States nominated a deficit of $31.7 billion and the Commonwealth nominated a deficit of $7.0 billion.
The Loan Council considered the macroeconomic implications of infrastructure spending from the three nation‑building funds. Given the size and likely timing profile of any spending on new projects, the Loan Council determined that the drawdown of the remaining balances in the funds is not likely to have a material impact on the economy.
The Loan Council agreed to the cessation of reporting on the Guarantee. The final report determined that the Guarantee was being used to support state infrastructure investment and was not being used inappropriately.
Developments since the 2012 Loan Council meeting
As part of the Loan Council arrangements, all jurisdictions are required to update their Loan Council Allocation to reflect their Budget and to provide an explanation to the Loan Council if they are likely to exceed the tolerance limit.
2012‑13 Loan Council Allocation budget updates are available in the States' 2012‑13 Budgets. Since the Loan Council meeting on 4 April 2012, Victoria and the Northern Territory have released their 2012‑13 Budgets. Both States breached the tolerance limits set at the 2012 Loan Council meeting.
The Commonwealth's 2012‑13 Loan Council Allocation budget update is available in Budget Paper No. 1, Statement 9, Appendix B.
Table 4.1: Loan Council Allocation nominations for 2012‑13(a)
| NSW $m |
VIC $m |
QLD $m |
WA $m |
SA $m |
TAS $m |
ACT $m |
NT $m |
C'wlth $m |
Total $m |
|
|---|---|---|---|---|---|---|---|---|---|---|
| Nominated 2012-13 LCAs | ||||||||||
| General government sector cash surplus(-)/deficit(+) | 2,726 | 898 | 7,456 | 2,054 | 1,089 | 10 | 468 | 251 | -4,490 | |
| PNFC sector cash surplus(-)/deficit(+) | 3,844 | 3,402 | 2,945 | 1,897 | -811 | 607 | 90 | 245 | 948 | |
| Non-financial public sector cash surplus(-)/deficit(+)(b) | 6,570 | 4,300 | 10,401 | 3,951 | 278 | 617 | 558 | 496 | -3,542 | |
| Acquisitions under finance leases and similar arrangements |
704 | 845 | 15 | 0 | 0 | 0 | 0 | 0 | 404 | |
| equals ABS GFS cash surplus(-)/deficit(+) | 7,274 | 5,145 | 10,416 | 3,951 | 278 | 617 | 558 | 496 | -3,137 | |
| minus Net cash flows from investments in financial assets for policy purposes(c) |
-445 | -7 | -60 | 0 | 7 | -9 | 2 | 0 | -10,867 | |
| plus Memorandum items(d) | 840 | 367 | 1,788 | -76 | -501 | 36 | -9 | 0 | -761 | |
| Loan Council Allocations | 8,559 | 5,520 | 12,264 | 3,875 | -230 | 661 | 547 | 496 | 6,969 | 38,661 |
| 2012-13 tolerance limit(e) | 1,557 | 1,053 | 1,093 | 864 | 335 | 168 | 95 | 103 | 7,516 |
(a) Loan Council Allocation (LCA) nominations for 2012‑13 reflect best estimates of cash surpluses/deficits. Nominations have been provided on the basis of policies announced up to and including jurisdictions' mid‑year financial reports and the Commonwealth's Mid‑Year Economic and Fiscal Outlook 2011‑12. Each jurisdiction will publish an updated LCA estimate as part of its budget documentation.
(b) The sum of the general government and PNFC sector balances may not equal the non‑financial public sector (NFPS) balance due to intersectoral transfers.
(c) Net cash flows from investments in financial assets for policy purposes comprise net lending by governments with the aim of achieving government policy as well as net equity sales and net lending to other sectors or jurisdictions. Such transactions involve the transfer or exchange of a financial asset and are not included within the cash deficit. However, these flows have implications for a government's call on financial markets. Net cash flows from investments in financial assets for policy purposes are displayed with the same sign as reported in cash flow statements.
(d) Memorandum items are used to adjust the NFPS surplus/deficit to include in LCAs certain transactions — such as operating leases — that have many of the characteristics of public sector borrowings but do not constitute formal borrowings. They are also used, where appropriate, to deduct from the NFPS surplus/deficit certain transactions that the Loan Council has agreed should not be included in LCAs; for example, the funding of more than employers' emerging costs under public sector superannuation schemes, or borrowings by entities such as statutory marketing authorities. Where relevant, memorandum items include an amount for gross new borrowings of government home finance schemes.
(e) Tolerance limits are designed, inter alia, to accommodate changes to LCAs resulting from changes in policy. Tolerance limits apply between jurisdictions' LCA nominations and budget estimates, and again between budget estimates and outcomes. They are calculated as two per cent of NFPS cash receipts from operating activities in each jurisdiction.
If www.budget.gov.au responds slowly or you are having trouble downloading a document, try one of the Budget Website Mirrors
Note: Where possible, Budget documents are available in HTML and for downloading in Portable Document Format(PDF). If you require further information on any of the tables or charts on this website, please contact The Treasury.
