




Part 3: Fiscal strategy and outlook (Continued)
Fiscal outlook (continued)
Fiscal balance estimates
The fiscal balance is expected to be in surplus by $1.2 billion in 2012‑13, a deterioration of $1.3 billion from the expectation in the 2012‑13 Budget.
Table 3.10 provides a reconciliation of fiscal balance estimates, including the impact of policy decisions and parameter and other variations on revenue, expense and net capital investment.
| Estimates | Projections | ||||
|---|---|---|---|---|---|
| 2012-13 $m |
2013-14 $m |
2014-15 $m |
2015-16 $m |
||
| 2012-13 Budget fiscal balance | 2,500 | 2,646 | 7,020 | 9,457 | |
| Per cent of GDP | 0.2 | 0.2 | 0.4 | 0.5 | |
| Changes from 2012-13 Budget to 2012-13 MYEFO | |||||
| Effect of policy decisions(a)(b) | |||||
| Revenue | 839 | 6,486 | 2,918 | 2,499 | |
| Expenses | 215 | 530 | 596 | 223 | |
| Net capital investment | 238 | 104 | -120 | -149 | |
| Total policy decisions impact on fiscal balance | 386 | 5,852 | 2,442 | 2,424 | |
| Effect of parameter and other variations(a) | |||||
| Revenue | -3,171 | -5,522 | -5,877 | -5,620 | |
| Expenses | -1,439 | -1,179 | -3,340 | -3,456 | |
| Net capital investment | -53 | -121 | 2 | -46 | |
| Total parameter and other variations impact on fiscal balance | -1,679 | -4,222 | -2,539 | -2,118 | |
| 2012-13 MYEFO fiscal balance | 1,207 | 4,275 | 6,923 | 9,762 | |
| Per cent of GDP | 0.1 | 0.3 | 0.4 | 0.5 | |
(a) A positive number for revenue indicates an increase in the fiscal balance, while a positive number for expenses and net capital investment indicates a decrease in the fiscal balance.
(b) Excludes secondary impacts on public debt interest of policy decisions and offsets from the Contingency Reserve for decisions taken.
Revenue estimates
Total revenue has been revised down by $2.3 billion in 2012‑13. While changes in revenue are generally driven by the same factors as receipts, there are differences as not all revenue raised in a given year is actually paid in that year. For example, past tax assessments may be amended as a result of compliance activity or the settlement of legal disputes and taxpayers may accrue new tax debts. These differences exist for most revenue heads, and vary across years.
Movements in non‑taxation revenue that are not matched by an equal movement in non‑taxation receipts include:
- the dividends expected to be received by the Government from the RBA ($500 million) and the Australian Reinsurance Pool Commission ($400 million over four years), which have a significantly different impact on accrual revenue compared to cash receipts. The dividend revenue is recognised when the entitlement to the dividend is established, not when the dividend receipt is received;
- a reduction in the revenue attributable to the Higher Education Loan Program of $348 million in 2012‑13 as a result of revised discount rates used in the valuation of student loans, with no impact on the underlying cash balance. The decrease in revenue is more than offset by a decrease in expenses relating to the revised discount rate; and
- changes to the operation of lost superannuation account provisions where there are differences between the timing of accrual revenue and expenses compared to cash receipts and payments (a difference of $63 million across the forward estimates).
Detailed Australian Government general sector revenue estimates for 2012‑13 and 2013‑14, compared with the estimates published in the 2012‑13 Budget, are provided in Tables 3.11 and 3.12 respectively.
| Estimates | Change on Budget | ||||
|---|---|---|---|---|---|
| Budget $m |
MYEFO $m |
$m |
% |
||
| Individuals' and other withholding taxes | |||||
| Gross income tax withholding | 151,620 | 152,590 | 970 | 0.6 | |
| Gross other individuals | 37,670 | 37,840 | 170 | 0.5 | |
| less: Refunds | 26,240 | 26,500 | 260 | 1.0 | |
| Total individuals' and other withholding taxation | 163,050 | 163,930 | 880 | 0.5 | |
| Fringe benefits tax | 3,900 | 4,040 | 140 | 3.6 | |
| Company tax | 75,032 | 72,982 | -2,050 | -2.7 | |
| Superannuation funds | 8,250 | 8,250 | 0 | 0.0 | |
| Resource rent taxes(a) | 7,410 | 5,580 | -1,830 | -24.7 | |
| Income taxation revenue | 257,642 | 254,782 | -2,860 | -1.1 | |
| Sales taxes | |||||
| Goods and services tax | 50,486 | 50,790 | 304 | 0.6 | |
| Wine equalisation tax | 780 | 720 | -60 | -7.7 | |
| Luxury car tax | 450 | 450 | 0 | 0.0 | |
| Total sales taxes | 51,716 | 51,960 | 244 | 0.5 | |
| Excise duty | |||||
| Petrol | 5,900 | 6,000 | 100 | 1.7 | |
| Diesel | 8,700 | 8,700 | 0 | 0.0 | |
| Beer | 2,035 | 2,070 | 35 | 1.7 | |
| Tobacco | 5,850 | 5,200 | -650 | -11.1 | |
| Other excisable products | 4,400 | 4,520 | 120 | 2.7 | |
| Of which: Other excisable beverages(b) | 940 | 930 | -10 | -1.1 | |
| Total excise duty revenue | 26,885 | 26,490 | -395 | -1.5 | |
| Customs duty | |||||
| Textiles, clothing and footwear | 730 | 700 | -30 | -4.1 | |
| Passenger motor vehicles | 940 | 920 | -20 | -2.1 | |
| Excise-like goods | 4,370 | 4,850 | 480 | 11.0 | |
| Other imports | 1,510 | 1,540 | 30 | 2.0 | |
| less: Refunds and drawbacks | 180 | 180 | 0 | 0.0 | |
| Total customs duty revenue | 7,370 | 7,830 | 460 | 6.2 | |
| Carbon pricing mechanism | 7,690 | 7,690 | - | - | |
| Other indirect taxation | |||||
| Agricultural levies | 440 | 440 | 0 | 0.0 | |
| Other taxes | 2,883 | 2,900 | 17 | 0.6 | |
| Total other indirect taxation revenue | 3,323 | 3,339 | 17 | 0.5 | |
| Indirect taxation revenue | 96,984 | 97,309 | 326 | 0.3 | |
| Taxation revenue | 354,626 | 352,092 | -2,534 | -0.7 | |
| Sales of goods and services | 8,264 | 8,594 | 330 | 4.0 | |
| Interest | 5,113 | 4,465 | -648 | -12.7 | |
| Dividends | 2,485 | 2,479 | -6 | -0.2 | |
| Other non-taxation revenue | 5,583 | 6,109 | 526 | 9.4 | |
| Non-taxation revenue(c) | 21,445 | 21,647 | 202 | 0.9 | |
| Total revenue(c) | 376,071 | 373,739 | -2,332 | -0.6 | |
| Memorandum: | |||||
| Capital gains tax | 10,200 | 8,400 | -1,800 | -17.6 | |
| Medicare levy revenue | 9,640 | 9,700 | 60 | 0.6 | |
(a) Resource rent taxes include PRRT and gross revenue from the MRRT.
(b) Other excisable beverages are those not exceeding 10 per cent by volume of alcohol (excluding beer, brandy and wine).
(c) Includes Future Fund earnings.
| Estimates | Change on Budget | ||||
|---|---|---|---|---|---|
| Budget $m |
MYEFO $m |
$m |
% |
||
| Individuals' and other withholding taxes | |||||
| Gross income tax withholding | 164,980 | 165,250 | 270 | 0.2 | |
| Gross other individuals | 40,250 | 40,080 | -170 | -0.4 | |
| less: Refunds | 26,430 | 26,700 | 270 | 1.0 | |
| Total individuals' and other withholding taxation | 178,800 | 178,630 | -170 | -0.1 | |
| Fringe benefits tax | 4,390 | 4,530 | 140 | 3.2 | |
| Company tax | 77,901 | 80,459 | 2,558 | 3.3 | |
| Superannuation funds | 9,220 | 9,290 | 70 | 0.8 | |
| Resource rent taxes(a) | 8,350 | 6,560 | -1,790 | -21.4 | |
| Income taxation revenue | 278,661 | 279,469 | 808 | 0.3 | |
| Sales taxes | |||||
| Goods and services tax | 53,234 | 53,730 | 496 | 0.9 | |
| Wine equalisation tax | 830 | 730 | -100 | -12.0 | |
| Luxury car tax | 460 | 460 | 0 | 0.0 | |
| Total sales taxes | 54,524 | 54,920 | 396 | 0.7 | |
| Excise duty | |||||
| Petrol | 5,380 | 5,840 | 460 | 8.6 | |
| Diesel | 9,200 | 9,120 | -80 | -0.9 | |
| Beer | 2,183 | 2,140 | -43 | -2.0 | |
| Tobacco | 5,190 | 4,710 | -480 | -9.2 | |
| Other excisable products | 4,710 | 4,640 | -70 | -1.5 | |
| Of which: Other excisable beverages(b) | 1,030 | 990 | -40 | -3.9 | |
| Total excise duty revenue | 26,663 | 26,450 | -213 | -0.8 | |
| Customs duty | |||||
| Textiles, clothing and footwear | 785 | 720 | -65 | -8.3 | |
| Passenger motor vehicles | 1,020 | 960 | -60 | -5.9 | |
| Excise-like goods | 5,310 | 5,850 | 540 | 10.2 | |
| Other imports | 1,635 | 1,680 | 45 | 2.8 | |
| less: Refunds and drawbacks | 180 | 180 | 0 | 0.0 | |
| Total customs duty revenue | 8,570 | 9,030 | 460 | 5.4 | |
| Carbon pricing mechanism | 8,685 | 8,685 | 0 | 0 | |
| Other indirect taxation | |||||
| Agricultural levies | 436 | 436 | 0 | 0.0 | |
| Other taxes | 3,188 | 3,033 | -155 | -4.9 | |
| Total other indirect taxation revenue | 3,625 | 3,470 | -155 | -4.3 | |
| Indirect taxation revenue | 102,067 | 102,555 | 488 | 0.5 | |
| Taxation revenue | 380,727 | 382,023 | 1,296 | 0.3 | |
| Sales of goods and services | 8,641 | 8,791 | 149 | 1.7 | |
| Interest | 5,209 | 4,628 | -580 | -11.1 | |
| Dividends | 1,966 | 1,950 | -16 | -0.8 | |
| Other non-taxation revenue | 5,654 | 5,769 | 115 | 2.0 | |
| Non-taxation revenue(c) | 21,470 | 21,138 | -332 | -1.5 | |
| Total revenue(c) | 402,197 | 403,161 | 964 | 0.2 | |
| Memorandum: | |||||
| Capital gains tax | 12,900 | 11,000 | -1,900 | -14.7 | |
| Medicare levy revenue | 10,250 | 10,390 | 140 | 1.4 | |
(a) Resource rent taxes include PRRT and gross revenue from the MRRT.
(b) Other excisable beverages are those not exceeding 10 per cent by volume of alcohol (excluding beer, brandy and wine).
(c) Includes Future Fund earnings.
Expense and net capital investment
Movements in accrual expenses and net capital investment over the forward estimates are broadly similar to the movements in cash payments. The key exceptions include:
- an increase in accrued superannuation expenses for civilian superannuation schemes of $1.1 billion reflecting differences between the timing of cash payments and accrued expenses;
- a reduction in the expenses attributable to the concessional loans under the Higher Education Loan Program (HELP) of $736 million in 2012‑13 as a result of revised discount rates used in the valuation of student loans, with no impact on the underlying cash balance. This expense reduction is related to the decrease in HELP revenue outlined above; and
- the provision of GST to the States and Territories, reflecting higher than estimated GST entitlements ($440 million) relating to the 2011‑12 financial year. This amount was accrued in 2011‑12 and will be paid in 2012‑13.
Estimates of Australian Government general expenses by function can be found in Attachment C.
Table 3.13 provides a reconciliation of expense estimates.
| Estimates | Projections | ||||
|---|---|---|---|---|---|
| 2012-13 $m |
2013-14 $m |
2014-15 $m |
2015-16 $m |
||
| 2012-13 Budget expenses | 376,273 | 398,503 | 416,449 | 439,044 | |
| Changes from 2012-13 Budget to 2012-13 MYEFO | |||||
| Effect of policy decisions(a) | 215 | 530 | 596 | 223 | |
| Effect of economic parameter variations | |||||
| Total economic parameter variations | 245 | 576 | 29 | 199 | |
| Unemployment benefits | -197 | 186 | -59 | -67 | |
| Prices and wages | 391 | 288 | -113 | -60 | |
| Interest and exchange rates | 1 | 1 | 1 | 1 | |
| GST payments to the States | 50 | 100 | 200 | 325 | |
| Public debt interest | 0 | -313 | -377 | -527 | |
| Program specific parameter variations | 1,299 | -631 | -1,522 | -1,742 | |
| Other variations | -2,984 | -810 | -1,470 | -1,386 | |
| Total variations | -1,224 | -649 | -2,744 | -3,233 | |
| 2012-13 MYEFO expenses | 375,049 | 397,854 | 413,704 | 435,811 | |
(a) Excludes secondary impacts on public debt interest of policy decisions and offsets from the Contingency Reserve for decisions taken.
Table 3.14 provides a reconciliation of the net capital investment estimates.
| Estimates | Projections | ||||
|---|---|---|---|---|---|
| 2012-13 $m |
2013-14 $m |
2014-15 $m |
2015-16 $m |
||
| 2012-13 Budget net capital investment | -2,701 | 1,048 | 1,361 | 1,059 | |
| Changes from 2012-13 Budget to 2012-13 MYEFO | |||||
| Effect of policy decisions(a) | 238 | 104 | -120 | -149 | |
| Effect of parameter and other variations | -53 | -121 | 2 | -46 | |
| Total variations | 185 | -17 | -118 | -194 | |
| 2012-13 MYEFO net capital investment | -2,517 | 1,032 | 1,244 | 865 | |
(a) Excludes secondary impacts on public debt interest of policy decisions and offsets from the Contingency Reserve for decisions taken.
Net debt, net financial worth and net worth
Net debt for the Australian Government general government sector is expected to be $144.0 billion (or 9.4 per cent of GDP) in 2012‑13, slightly higher than the level expected in the 2012‑13 Budget ($143.3 million or 9.2 per cent of GDP).
The increase in the expected level of net debt since the Budget is primarily driven by an increase in the market value of the stock of Commonwealth Government Securities (CGS) on issue, owing to lower yields (interest rates) than were assumed at the time of the Budget.
The impact on net debt from the increase in the market value of CGS has been partially offset by an increase in the value of some financial assets, including an increase in the value of HELP assets.
Net debt is expected to have peaked, as a percentage of GDP, at 10 per cent in 2011‑12, and is expected to reduce to 7.7 per cent of GDP in 2015‑16. Australia's level of net debt remains low by international standards. Based on the latest IMF forecasts, the average level of net debt for the major advanced economies (G7), measured for all levels of government, was 84.1 per cent of GDP in 2011. The average net debt position of the major advanced economies is projected to peak at 95 per cent of GDP in 2016, almost ten times higher than the expected peak in Australia's net debt.
Net financial worth for the Australia Government general government sector is expected to be ‑$257.9 billion (16.9 per cent of GDP) in 2012‑13, compared to the Budget estimate of ‑$248.6 billion (16.0 per cent of GDP). Net worth for the Australian Government general government sector is expected to be ‑$145.3 billion (9.5 per cent of GDP) in 2012‑13, compared to the Budget estimate of ‑$137.8 billion (8.9 per cent of GDP).
The changes to net debt described above also impact on net financial worth and net worth. Other factors impacting on the value of net financial worth and net worth in 2012‑13 since the Budget include increases in the provisions for military workers compensation and university superannuation as a result of actuarial revaluations.
Table 3.15 provides a summary of Australian Government general government sector net financial worth, net worth, net debt and net interest payments.
| Estimates | |||||
|---|---|---|---|---|---|
| 2012-13 | 2013-14 | ||||
| Budget $b |
MYEFO $b |
Budget $b |
MYEFO $b | ||
| Financial assets | 238.5 | 245.7 | 255.4 | 263.8 | |
| Non-financial assets | 110.9 | 112.6 | 111.5 | 113.2 | |
| Total assets | 349.4 | 358.4 | 366.8 | 377.0 | |
| Total liabilities | 487.2 | 503.7 | 499.6 | 515.3 | |
| Net worth | -137.8 | -145.3 | -132.8 | -138.3 | |
| Net financial worth(a) | -248.6 | -257.9 | -244.3 | -251.5 | |
| Per cent of GDP | -16.0 | -16.9 | -15.0 | -15.6 | |
| Net debt(b) | 143.3 | 144.0 | 144.9 | 144.6 | |
| Per cent of GDP | 9.2 | 9.4 | 8.9 | 9.0 | |
| Net interest payments | 7.0 | 7.1 | 6.8 | 6.6 | |
| Per cent of GDP | 0.5 | 0.5 | 0.4 | 0.4 | |
| Projections | |||||
| 2014-15 | 2015-16 | ||||
| Budget $b |
MYEFO $b |
Budget $b |
MYEFO $b |
||
| Financial assets | 269.6 | 281.1 | 283.4 | 294.8 | |
| Non-financial assets | 112.2 | 113.9 | 114.0 | 115.5 | |
| Total assets | 381.9 | 395.0 | 397.4 | 410.3 | |
| Total liabilities | 505.5 | 524.1 | 509.1 | 527.2 | |
| Net worth | -123.6 | -129.1 | -111.8 | -116.9 | |
| Net financial worth(a) | -235.9 | -243.0 | -225.8 | -232.4 | |
| Per cent of GDP | -13.7 | -14.3 | -12.4 | -13.0 | |
| Net debt(b) | 140.1 | 144.3 | 131.6 | 137.7 | |
| Per cent of GDP | 8.1 | 8.5 | 7.3 | 7.7 | |
| Net interest payments | 7.0 | 6.7 | 8.2 | 7.8 | |
| Per cent of GDP | 0.4 | 0.4 | 0.4 | 0.4 | |
(a) Net financial worth equals total financial assets minus total liabilities.
(b) Net debt equals the sum of deposits held, government securities, loans and other borrowing, minus the sum of cash and deposits, advances paid and investments, loans and placements.
Medium term
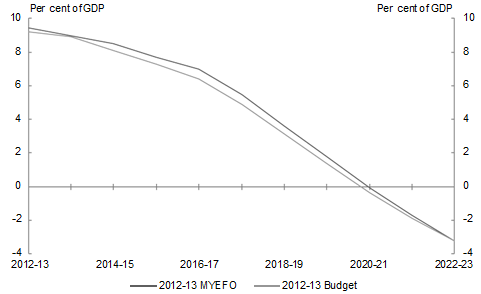
The budget position is projected to continue to strengthen over the medium term. The underlying cash balance is projected to reach a surplus of 1 per cent of GDP in 2017‑18, the same year as projected in Budget. This reflects the natural recovery in tax receipts as the economy continues to grow and the application of the Government's commitment to hold real growth in spending to 2 per cent a year, on average, until the budget surplus is at least 1 per cent of GDP, and while the economy is growing at or above trend (Chart 3.2). Net debt is projected to return to zero in 2020‑21, also unchanged from Budget (Chart 3.3).
Chart 3.2: Underlying cash balances projected to 2022‑23
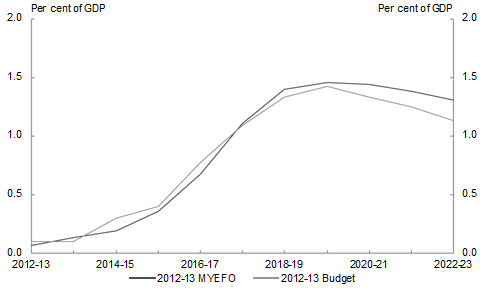
Chart 3.3: Government net debt projected to 2022‑23
If www.budget.gov.au responds slowly or you are having trouble downloading a document, try one of the Budget Website Mirrors
Note: Where possible, Budget documents are available in HTML and for downloading in Portable Document Format(PDF). If you require further information on any of the tables or charts on this website, please contact The Treasury.
