




Statement 2: Economic Outlook (Continued)
Overview
The outlook for the Australian economy is favourable, with solid growth, low unemployment and well‑contained inflation. GDP growth is forecast to be close to trend at 2¾ per cent in 2013‑14 and 3 per cent in 2014‑15, and the economy is expected to continue to outperform most other advanced economies over the forecast period. However, nominal GDP growth is expected to remain subdued, reflecting the falling terms of trade and the enduring effect of the persistently high Australian dollar on profits and prices in many sectors of the economy, particularly those that are trade‑exposed.
Global financial market conditions have improved noticeably since late 2012 and while global growth remains subdued, it is expected to strengthen over the forecast period. There are signs that economic conditions have stabilised in China and strengthened moderately in the United States and Japan, though this is partly offset by the deepening recession in the euro area.
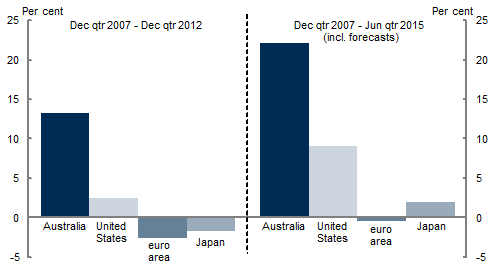
The Australian economy is expected to continue to outperform most other advanced economies over the forecast period (Chart 1). While other countries have struggled to overcome weak growth and high unemployment, Australia's growth has remained around trend and the unemployment rate has stayed low, with the Australian economy now more than 13 per cent larger than in late 2007. By the end of the forecast period, the Australian economy is expected to be around 22 per cent larger than in late 2007. This growth is well above that expected in the United States, Japan and the euro area (Box 1).
Chart 1: Real GDP Growth
Source: ABS cat. no. 5206.0, national statistical agencies, Thomson Reuters and Treasury.
Around half of all advanced economies are yet to return to pre‑crisis output levels, and a number have returned to recession. The sluggish recovery underway in most advanced economies has also reinforced the profound structural changes in the global economy. As the centre of global economic activity shifts towards Asia, emerging market economies are expected to account for around three‑quarters of global growth over the forecast period, with emerging Asian economies, particularly China and India, driving the bulk of this growth.
Continued strong growth in our region will provide a solid foundation for opportunity and economic growth in Australia. External demand from Asia, particularly for resources like iron ore, coal and liquefied natural gas (LNG), is expected to remain strong. Strong growth in emerging Asia will also open up new export opportunities outside the resources sector, as a growing Asian middle class increasingly demands a diverse range of higher quality goods and services.
The resources sector has responded to the unprecedented growth in demand for resources from Asia with the largest investment boom in Australian history. Total resources investment surged to over $100 billion in 2011‑12, more than 600 per cent higher than it was a decade ago. LNG projects are increasingly dominating the pipeline of investment, driven by the demand for energy in Asia, but large‑scale investment in iron ore and coal extraction and transportation is also contributing to a lift in export capacity.
Resources investment is expected to peak in 2013‑14 at record highs, and then remain elevated through to at least the middle of the decade. The pipeline of resources investment remains substantial, with over $260 billion of investment either committed to or under construction. While resources investment will begin to detract from growth after it passes its peak, the resources sector will continue to make an important contribution to growth as the record level of investment fuels exceptional growth in resources production and exports. Non‑rural commodity export volumes are expected to grow by more than 30 per cent from 2011‑12 to 2014‑15.
Just as the resources boom will transition from its investment phase to the production phase over the next two years, the broader Australian economy is also expected to begin its transition to non‑resources drivers of growth. Growth in the non‑resources parts of the economy is expected to be underpinned by solid growth in household consumption, a recovery in the housing sector and a modest recovery in business investment outside the resources sector. While this transition may not be seamless, Australia starts from a position of strength and resilience.
Household consumption is expected to grow solidly over the forecast period, and provide a platform for recovery in some non‑resources parts of the economy. Recent interest rate cuts have supported a tentative rebound in consumer confidence, and improved global financial market sentiment alongside recent growth in equities markets and house prices are supporting growth in household wealth. Recent strength in retail trade is also indicative of the recovery underway in household consumption, with positive implications for the retail sector and other related sectors, such as wholesale trade and road transport. Nonetheless, a return to the strong but unsustainable pre‑crisis growth rates of household consumption is not expected.
There are also early signs of a recovery in the housing sector. In the December quarter National Accounts, dwelling investment recorded its second consecutive quarter of positive growth, growing at its strongest quarterly rate in over two years. After a decade of lacklustre growth in housing construction, conditions are favourable for a sustained recovery. Low interest rates, favourable demographics, low vacancy rates, rising house prices and high rental yields are all expected to support demand in the housing construction sector over the forecast period.
Growth in business investment outside the resources sector has been subdued since the global financial crisis, with many firms reluctant to invest during a period of global uncertainty. However, non‑resources investment is expected to pick up modestly over the forecast period as firms build capital stocks to respond to strong external demand from Asia and improving conditions in the non‑resources sectors at home. While credit conditions tightened substantially during the global financial crisis, these pressures have since eased, and are not expected to constrain business investment over the forecast period. Investment will also be supported by low interest rates and the low cost of imported capital goods.
However, in the near term, economic growth outside the resources sector will continue to face some headwinds, and conditions are expected to remain uneven across the economy. This partly reflects the magnitude of the transition underway, but also structural challenges — such as the persistently high Australian dollar — which are weighing heavily on a number of sectors.
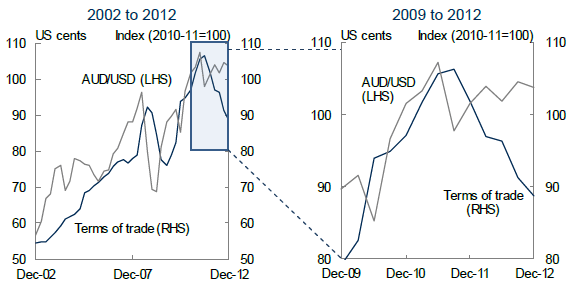
Despite the lower terms of trade and declining prices for Australia's key commodity exports, the Australian dollar remains around parity with the US dollar (Chart 2), and has appreciated by around 20 per cent against the Japanese yen over the past six months. The trade weighted index of the Australian dollar also remains near 30‑year highs. While the strength of the Australian dollar reflects the fundamental strength of the Australian economy, the persistently high dollar is producing especially challenging conditions in labour intensive and trade‑exposed sectors such as manufacturing and tourism. In the retail and wholesale trade sectors, consumer caution and changing spending patterns have added to the competitive pressure to pass on lower import prices, which has squeezed profit margins.
Chart 2: Terms of Trade and the Australian dollar
Source: ABS cat. no. 5302.0 and 5206.0.
Employment growth has been modest over the past 12 months, reflecting the uneven conditions across the economy and the dampening effect of the persistently high Australian dollar on trade‑exposed sectors. Still, the unemployment rate has remained low and risen only slightly to its current level of 5.5 per cent. This stands in stark contrast to most other developed economies. The average unemployment rate across the OECD has remained stubbornly high at around 8 per cent. In the euro area, the unemployment rate has continued to climb over the past year and now stands at euro‑era highs of around 12 per cent. In the United States, the unemployment rate has also remained high and is currently around 7½ per cent.
Employment growth is expected to strengthen as growth picks up in some non‑resources sectors of the economy and the level of employment remains high in the resources sector. Employment in Australia is expected to grow by 1¼ per cent to the June quarter 2014 and 1½ per cent to the June quarter 2015, and over 350,000 jobs are expected to be created over the forecast period. However, with the resources sector transitioning to the less labour intensive production phase, and the high Australian dollar still weighing on many sectors of the economy, the unemployment rate is expected to rise by ¼ of a percentage point to 5¾ per cent in 2013‑14, but then stabilise at that level over the remainder of the forecast period and remain amongst the lowest in the developed world. In line with the slight rise in the unemployment rate, wage growth is expected to be slightly below trend, and inflation is forecast to be well contained in the bottom half of the Reserve Bank's target band.
The outlook for solid economic growth is consistent with the fiscal consolidation underway at all levels of government. Consolidation at the federal level has been targeted to limit any adverse impact on economic growth and employment, and the expected overall effect of policy decisions in 2012‑13 and 2013‑14 is largely unchanged since MYEFO. Fiscal consolidation has provided scope for an easing in monetary policy, with the Reserve Bank reducing the cash rate by 200 basis points since November 2011. With wage growth and inflation remaining contained, ongoing fiscal consolidation will continue to provide scope for monetary policy to respond to conditions as appropriate. As is standard practice, the forecasts assume policy interest rates move broadly in line with market expectations at the time that the forecasts are finalised, with the market expectation at that time being that policy interest rates would be slightly lower over the coming year.
Australia's current low unemployment rate and solid real GDP growth are a testament to the resilience of Australia's real economy over the past five years. However, Australia's nominal economy has been less immune to global conditions over this period, with prices absorbing much of the effect of a weaker global economy, declining terms of trade, and high Australian dollar. Although iron ore prices have recovered from their lows of late 2012, the unusual combination of a persistently high dollar and lower terms of trade has put acute competitive pressure on resources and non‑resources sectors, resulting in weaker profitability, subdued price growth, and unusually low nominal GDP growth.
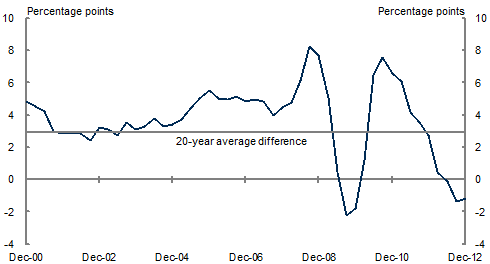
Nominal GDP growth has historically exceeded real GDP growth by around 2½ percentage points, but this relationship has reversed recently (Chart 3). Nominal GDP grew by only 2.0 per cent through the year to the December quarter 2012, well below the rate of real GDP growth of 3.1 per cent. This was the third consecutive quarter where nominal GDP growth was outpaced by real GDP growth, the first time this has happened in at least the past half‑century.
Chart 3: Difference between nominal and real GDP growth (through the year)
Source: ABS cat. no. 5206.0.
Notwithstanding some volatility in iron ore prices toward the end of 2012, non‑rural bulk commodity prices have fallen over the past twelve months. Iron ore spot prices in early May 2013 are around 30 per cent lower than their peak in 2010‑11, while thermal and metallurgical coal prices have fallen from peaks in 2008‑09 and 2010‑11 respectively. With overall export prices expected to continue to weaken over the forecast period, the terms of trade are expected to decline by 14 per cent from their peak in late 2011 to 2014‑15, placing continued downward pressure on nominal GDP growth.
Domestic price pressures are also expected to remain subdued over the forecast period. Despite business investment reaching record highs as a share of GDP, growth in investment and producer prices has remained contained. Outside the resources sector, measures of capacity utilisation have been subdued since the global financial crisis, while the Australian dollar has remained elevated, making conditions unusually challenging for firms operating in the trade‑exposed sectors of the economy. In response to these pressures, firms have been absorbing costs rather than passing on higher prices, which has weighed on profitability. However, many firms are also adapting to these pressures by improving productivity and adjusting business models. These acute competitive pressures are expected to persist over the forecast period, and will continue to place downward pressure on prices and nominal GDP growth.
Despite increased pressures from the economic transition and the high Australian dollar, Australia's economic fundamentals are expected to remain strong over the forecast period. Real GDP growth is forecast to remain close to trend at around 2¾ per cent in 2013‑14 before rising to 3 per cent in 2014‑15. The unemployment rate is expected to remain low and inflation is forecast to remain well contained.
The key international risk is the potential for a re‑escalation of the euro area crisis, as highlighted by recent developments in Italy and Cyprus. Many developed economies are still struggling to achieve sustainable growth and reduce high rates of unemployment. In the euro area, more growth‑oriented fiscal policies are warranted in those countries that have the capacity to implement them. More progress also needs to be made towards a banking and fiscal union, and to implement deep reforms to product and labour markets that would boost growth.
In the United States, the already fragile recovery is at risk if policymakers fail to raise the debt ceiling in a timely manner. There is also a need to develop a better pathway for fiscal policy, with more supportive short‑term settings combined with the need for a credible and substantial medium‑term fiscal consolidation plan. However, recent policy actions in the United States and Europe have meant that some of the worst crisis risks have abated since the end of 2012, and global conditions are expected to gradually improve.
Domestically, the transmission of volatility abroad to commodity prices presents a considerable risk to the forecast for nominal GDP growth. Australia's own economic transition presents both upside and downside risks to the domestic outlook, but a key risk is that the transition to new drivers of growth will be less than seamless, with the persistently high Australian dollar weighing heavily on firms in the trade‑exposed sectors of the economy. Still, with a low unemployment rate, well‑contained inflation, and low public debt, Australia embarks on this transition with some of the strongest economic fundamentals in the developed world.
Box 1: International comparisons
Australia's economy continues to outperform most other advanced economies in terms of economic growth and employment.
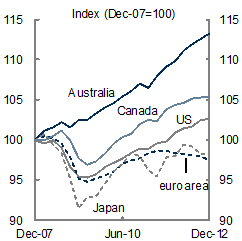
The Australian economy has grown by over 13 per cent since the end of 2007. By contrast, the United States economy has grown by around 3¼ per cent, and both the euro area and Japan are yet to make up lost ground following the global financial crisis (Chart A).
Chart A: Real GDP
Source: ABS cat. no. 5206.0, national statistical agencies, Thomson Reuters and Treasury.
Australia's outperformance is expected to continue. By the end of the forecast period, the Australian economy is expected to be around 22 per cent larger than in late 2007. This growth is well above that expected from the United States (around 9 per cent), Japan (around 2 per cent) and the euro area (which is not expected to return to late‑2007 levels by mid‑2015).
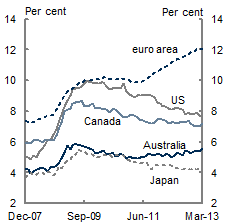
The Australian labour market also continues to outperform that of many other advanced economies. While many advanced economies experienced significant rises in their unemployment rates during the crisis, the unemployment rate rose less than 2 percentage points in Australia before easing back to around 5¼ per cent through 2011 and 2012 (Chart B).
Chart B: Unemployment rates
Source: ABS cat. no. 6202.0, national statistical agencies, Thomson Reuters and Treasury.
Australia's strong labour market performance over the past five years reflects the economy's resilience in the face of adverse global economic conditions, sound macroeconomic policy, and flexible working arrangements that have enabled the labour market to adjust through lower wage growth and a reduction in average hours worked rather than through job losses. The combination of these factors has resulted in Australia not experiencing the significant economic and social costs seen in many other advanced economies.
In contrast, the level of employment in the United States and euro area has fallen significantly and is yet to return to pre‑crisis levels (Chart C). While Australia has added around 950,000 jobs since the end of 2007, millions of jobs have been lost in other advanced economies, including more than 4 million in the euro area and around 2½ million in the United States. There are now around 200 million unemployed people worldwide, an increase of 28 million since 2007.
Despite a range of pressures from the weak global environment and high level of the dollar, the Australian unemployment rate has remained low, and at 5.5 per cent is lower than in every major advanced economy except Japan.
Chart C: Employment
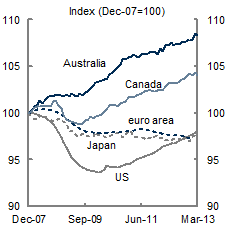
Note: Data for the euro area are quarterly.
Source: ABS cat. no. 6202.0, national statistical agencies, Thomson Reuters and Treasury.
Summary of forecasts
World GDP growth is expected to pick up gradually over the forecast period from its current subdued rate, as growth in emerging market economies picks up a little, the recovery in the United States continues to gradually gather momentum, and the euro area eventually recovers from recession. The world economy is forecast to grow by 3¼ per cent in 2013, and by 4 per cent in both 2014 and 2015.
Australia's major trading partners (export weighted) are expected to grow at a robust rate over the forecast period, reflecting the ongoing rapid growth of emerging Asia. Major trading partner growth is forecast to be 4½ per cent in 2013 and 4¾ per cent in both 2014 and 2015.
Australia's real GDP is forecast to grow by 2¾ per cent in 2013‑14 and by 3 per cent in 2014‑15. The main drivers of economic growth are expected to be non‑rural commodity exports and household consumption.
Household consumption is expected to grow solidly at 3 per cent in both 2013‑14 and 2014‑15. This outlook is consistent with moderate growth in employment and wages, and improving, but subdued, growth in household wealth. The household saving ratio is expected to ease but remain elevated over the forecast period.
Dwelling investment growth is expected to be above‑trend over the forecast period, with low interest rates, rising dwelling prices, favourable demographics and tight rental market conditions supporting a pick‑up in homebuyer demand. Dwelling investment is forecast to grow by 5 per cent in 2013‑14 and 5½ per cent in 2014‑15.
New business investment is expected to grow solidly in 2013‑14, growing by 4½ per cent and reaching a record high share of GDP. Growth is expected to moderate in 2014‑15 as resources‑related investment detracts from growth, but this should be partly offset by recovering investment outside the resources sector. New business investment is expected to grow by 1 per cent in 2014‑15.
Public final demand is expected to remain flat in 2013‑14, before growing by ½ of a per cent in 2014‑15, consistent with the fiscal consolidation underway across all levels of government.
Exports are expected to grow by 6½ per cent in 2013‑14 and 7 per cent in 2014‑15, driven by exceptional growth in non‑rural commodity exports, as a number of large resources projects progressively enter the export phase. Non‑commodity goods exports and services exports are expected to grow modestly, in line with the expected pick‑up in demand for higher quality goods and services from emerging market economies.
Imports are expected to grow by 6 per cent in 2013‑14 and by 3 per cent in 2014‑15. Capital goods imports associated with the expansion of the LNG sector are expected to be a significant driver of the increase in 2013‑14, though imports growth will slow as investment in the resources sector passes its peak.
The terms of trade are expected to decline by ¾ of a per cent in 2013‑14 and 1¾ per cent in 2014‑15, as increases in global supply, led by Australia, place downward pressure on some key non‑rural commodity prices. The decline in the terms of trade reflects the ongoing transition underway in the resources sector, from a phase of high prices driving a rapid expansion in supply, to one of strong growth in export volumes.
The current account deficit is expected to widen slightly to 3¾ per cent of GDP in 2013‑14 before narrowing to 3¼ per cent of GDP in 2014‑15. The widening of the deficit in 2013‑14 reflects continued strong growth in resources investment‑related imports coupled with the expected decline in the terms of trade. The subsequent narrowing in 2014‑15 reflects an improvement in the trade balance owing to strong growth in non‑rural bulk commodity exports.
Employment growth is expected to be 1¼ per cent through the year to the June quarter 2014 and 1½ per cent through the year to the June quarter 2015, as investment and growth pick up in the non‑resources sectors of the economy. The unemployment rate is expected to drift up slightly to 5¾ per cent by the June quarter 2014 and stabilise around this rate through to the June quarter 2015. The participation rate is forecast to remain close to historical highs at around 65 per cent.
Wage growth is expected to remain subdued over the forecast period, consistent with the outlook for moderate employment growth. The Wage Price Index is forecast to grow 3½ per cent through the year to the June quarters of 2014 and 2015.
Inflation is expected to remain well contained, consistent with ongoing competitive pressures from the sustained high dollar and the moderate outlook for wages and employment. Both Headline and underlying inflation are forecast to be 2¼ per cent through the year to the June quarters of 2014 and 2015.
Nominal GDP is expected to grow by 5 per cent in both 2013‑14 and 2014‑15, well below the 20‑year average of 6½ per cent. This largely reflects the expected decline in the terms of trade and slightly below‑trend growth in domestic prices.
| Outcomes(b) | Forecasts | |||
|---|---|---|---|---|
| 2011‑12 | 2012‑13 | 2013‑14 | 2014‑15 | |
| Panel A - Demand and output(c) | ||||
| Household consumption | 3.2 | 2 1/2 | 3 | 3 |
| Private investment | ||||
| Dwellings | -3.6 | 1/2 | 5 | 5 1/2 |
| Total business investment(d) | 20.8 | 10 1/2 | 4 1/2 | 1 |
| Non-dwelling construction(d) | 37.6 | 18 1/2 | 5 | -2 1/2 |
| Machinery and equipment(d) | 10.1 | 1 1/2 | 2 1/2 | 5 |
| Private final demand(d) | 6.2 | 4 | 3 1/2 | 2 3/4 |
| Public final demand(d) | 2.3 | - 1/2 | 0 | 1/2 |
| Total final demand | 5.3 | 3 | 2 3/4 | 2 1/4 |
| Change in inventories(e) | -0.1 | 0 | 0 | 0 |
| Gross national expenditure | 5.2 | 3 | 2 3/4 | 2 1/4 |
| Exports of goods and services | 4.7 | 7 | 6 1/2 | 7 |
| Imports of goods and services | 11.8 | 5 | 6 | 3 |
| Net exports(e) | -1.3 | 1/2 | 0 | 1 |
| Real gross domestic product | 3.4 | 3 | 2 3/4 | 3 |
| Non-farm product | 3.3 | 3 | 2 3/4 | 3 1/4 |
| Farm product | 9.0 | -8 | 4 | 0 |
| Nominal gross domestic product | 5.0 | 3 1/4 | 5 | 5 |
| Panel B - Other selected economic measures | ||||
| External accounts | ||||
| Terms of trade | 0.4 | -7 1/2 | - 3/4 | -1 3/4 |
| Current account balance (per cent of GDP) | -2.7 | -3 1/2 | -3 3/4 | -3 1/4 |
| Labour market | ||||
| Employment(f) | 1.2 | 1 1/4 | 1 1/4 | 1 1/2 |
| Unemployment rate (per cent)(g) | 5.1 | 5 1/2 | 5 3/4 | 5 3/4 |
| Participation rate (per cent)(g) | 65.3 | 65 | 65 | 65 |
| Prices and wages | ||||
| Consumer price index(h) | 1.2 | 2 1/2 | 2 1/4 | 2 1/4 |
| Gross non-farm product deflator | 1.7 | 0 | 2 | 1 3/4 |
| Wage price index(f) | 3.7 | 3 1/2 | 3 1/2 | 3 1/2 |
(a) Percentage change on preceding year unless otherwise indicated.
(b) Calculated using original data unless otherwise indicated.
(c) Chain volume measures except for nominal gross domestic product which is in current prices.
(d) Excluding second‑hand asset sales between the public sector and the private sector.
(e) Percentage point contribution to growth in GDP.
(f) Seasonally adjusted, through‑the‑year growth rate to the June quarter.
(g) Seasonally adjusted rate for the June quarter.
(h) Through‑the‑year growth rate to the June quarter.
Note: The forecasts are based on several technical assumptions. The exchange rate is assumed to remain around its recent average level — a trade‑weighted index of around 78 and a United States dollar exchange rate of around 103 US cents. Interest rates are assumed to move broadly in line with market expectations. World oil prices (Malaysian Tapis) are assumed to remain around US$106 per barrel. The farm sector forecasts are based on an assumption of average seasonal conditions.
Source: ABS cat. no. 5206.0, 5302.0, 6202.0, 6345.0, 6401.0, unpublished ABS data and Treasury.
Note: Where possible, Budget documents are available in HTML and for downloading in Portable Document Format(PDF). If you require further information on any of the tables or charts on this website, please contact The Treasury.
