




Statement 2: Economic Outlook (Continued)
Appendix A: Macroeconomic forecasting performance
The Government's macroeconomic forecasts are prepared using a range of modelling techniques, including structural macroeconometric models and equations, spreadsheet analyses and accounting frameworks. These are supplemented by survey data, business liaison, expert opinion and judgement.
In 2012, the Secretary to the Treasury commissioned an independently‑overseen Review of Treasury Macroeconomic and Revenue Forecasting performance.2
The Review concluded that the forecasts draw upon 'the full range of information and modelling techniques used by comparable agencies overseas', and place broadly appropriate weight on the various tools available to forecasters. The Review made 11 recommendations on how to improve forecasting performance, all of which are currently being implemented. This appendix responds to Recommendation 5:
Treasury should include in the Budget papers a high level review of the economic forecast errors (nominal and real GDP) for the previous financial year, as a complement to the existing discussion of revenue forecasting errors.
Macroeconomic forecasts are always subject to a margin of error. Charts 16 and 17 show the magnitude of the Budget year forecast error for real and nominal GDP growth over the past 20 years. The independent review concluded that, over this period, Treasury's forecasts of real GDP growth have exhibited little evidence of bias, with accuracy generally remaining within a range of ½ to 1 percentage point. However, in recent years, forecasts of real GDP growth have been less accurate, reflecting greater uncertainty about the path of real GDP during and after the global financial crisis. Treasury's experience has been broadly consistent with that of foreign counterparts and other Australian forecasters.
2011‑12 Real and nominal GDP growth forecasts
Economic forecasts for 2011‑12 were first published in the 2010‑11 Budget. Subsequent forecasts were published in the 2010‑11 MYEFO, 2011‑12 Budget, 2011‑12 MYEFO and 2012‑13 Budget.
Chart 16: Budget forecast of real GDP growth
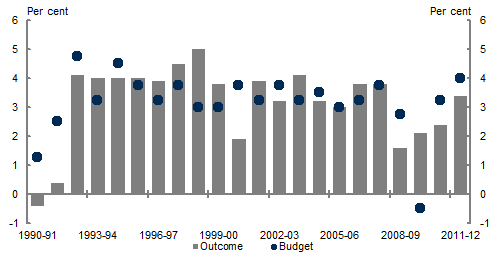
Note: Outcome is as published in the December quarter 2012 National Accounts. Forecast is that published in the Budget for that year.
Source: ABS cat. no. 5206.0 and Treasury.
Chart 17: Budget forecast of nominal GDP growth
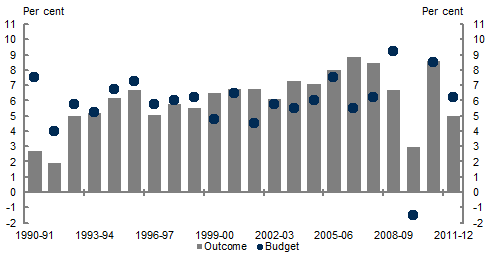
Note: Outcome is as published in the December quarter 2012 National Accounts. Forecast is that published in the Budget for that year.
Source: ABS cat. no. 5206.0 and Treasury.
In 2011‑12, Australia recorded above‑trend economic growth driven by surging resources sector investment and robust growth in household consumption. However, conditions in some parts of the economy were challenging, reflecting soft global conditions, the high dollar and shifting patterns of household demand. Above‑trend real GDP growth in 2011‑12 supported rising employment and a low unemployment rate, while underlying inflation remained contained.
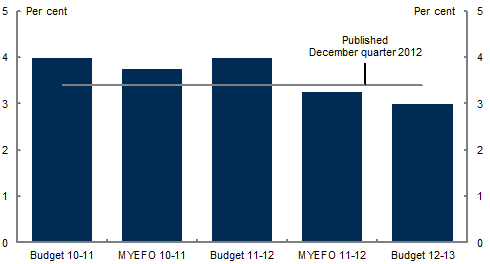
Chart 18 presents the evolution of Treasury's forecasts for 2011‑12 real GDP growth. The absolute percentage errors3 for 2011‑12 forecasts of real GDP growth were largest in the 2010‑11 Budget (at 0.7 percentage points) and smallest in the 2010‑11 MYEFO (at 0.1 percentage points). Over the past 20 years, Treasury's mean absolute percentage error for forecasts of real GDP growth in the budget year has been 0.9 percentage points at both Budget and MYEFO.
The largest absolute forecast errors occurred in forecasts of business and dwelling investment. Business investment in 2011‑12 was consistently underestimated as the upswing in resources investment gathered pace, while dwelling investment in 2011‑12 was consistently overestimated as supply constraints and changes to households' willingness to accumulate more debt unfolded.
Chart 18: Evolution of real GDP growth forecasts for 2011‑12
Source: ABS cat. no. 5206.0 and Treasury.
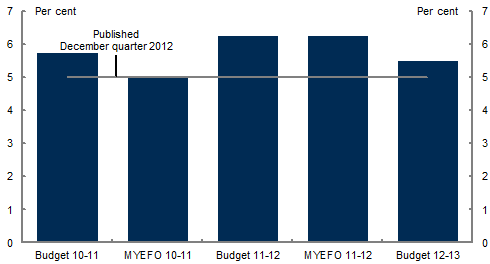
In 2011‑12, nominal GDP grew by 5.0 per cent as below‑trend growth in domestic prices and broadly flat terms of trade weighed on growth. Weakness in domestic prices was evident in both investment and consumption deflators. Chart 19 presents the evolution of Treasury's forecasts for 2011‑12 nominal GDP growth.
The absolute percentage errors in the forecasts of nominal GDP growth were largest in the 2011‑12 MYEFO (at 1.3 percentage points) and smallest in the 2010‑11 MYEFO (at 0.0 percentage points). Over the past 20 years, Treasury's mean absolute percentage error for forecasts of nominal GDP growth in the budget year has been 1.6 percentage points at Budget and 1.3 percentage points at MYEFO.
The largest absolute forecast errors in the components of nominal GDP growth were in forecasts of the terms of trade. Smaller forecast errors were recorded in forecasts of domestic prices and real GDP growth. Forecast errors for the terms of trade were largest for export prices, reflecting the difficulty of forecasting commodity prices during periods of substantial price volatility. Domestic price growth in 2011‑12 was consistently overestimated as the surge in resources investment was expected to put upward pressure on prices of investment goods, consistent with the experience prior to the global financial crisis. However, investment prices remained subdued in 2011‑12, partly owing to the sustained high level of the Australian dollar.
Chart 19: Evolution of nominal GDP growth forecasts for 2011‑12
Source: ABS cat. no. 5206.0 and Treasury.
2 http://www.treasury.gov.au/~/media/Treasury/Publications%20and%20Media/Publications/2013/forecasting_review/downloads/PDF/forecasting-review.ashx.
3 The absolute percentage error is an indicator of the accuracy of the forecasts, as it measures the distance between the forecast percentage growth rate and the outcome. All other things equal, a smaller number indicates a better forecasting performance.
Note: Where possible, Budget documents are available in HTML and for downloading in Portable Document Format(PDF). If you require further information on any of the tables or charts on this website, please contact The Treasury.
