




Economic Outlook
Australia's economic fundamentals are strong and the outlook remains positive, with solid growth, moderate unemployment and contained inflation. The Australian economy is in a strong position to withstand any further global volatility and is expected to continue outperforming most of the developed world over the forecast period. The transition is underway from the resources investment boom towards the non‑resources sectors and the economy is well positioned to manage this transition.
While prospects remain favourable, the challenges of transitioning away from the resources mining investment boom towards broader based growth are clear. Forecast real GDP growth in both 2012‑13 and 2013‑14 has been lowered by ¼ of a percentage point since Budget. As the transition unfolds, the unemployment rate is expected to reach 6¼ per cent by mid‑2014 and then stabilise at that level in 2014‑15 as growth returns to around trend. There have also been significant changes to forecast nominal GDP growth. Significant revisions to the terms of trade on the back of weaker Chinese growth, and lower forecast wage growth, have weighed heavily on nominal GDP and the fiscal position.
In recent years, strong economic outcomes have been supported by a record surge in resources investment, as businesses responded to high commodity prices driven by strong growth in China and other emerging market economies. However, with investment in iron ore and coal projects likely to have already peaked, future resources investment will be underpinned by LNG projects already under construction.
While the level of investment is expected to remain at historically elevated levels over the forecast period, managing the passing of the resources investment peak is the key near‑term economic challenge facing Australia. The record surge in investment has more than doubled the resource capital stock over the past decade, and this will support strong growth in non‑rural commodity exports for years to come.
The resources sector will therefore continue to make an important contribution to growth as it transitions to the production and exports phase. Nevertheless, higher exports are not expected to be sufficient to fully offset the impact on growth of the decline in resources investment. A rebalancing of economic growth towards non‑resources sectors is needed to fill the gap.
Low interest rates will support this transition, and there are signs that housing construction is responding to supportive monetary policy. The recent fall in the Australian dollar should also help, by increasing the competitiveness of Australian goods and services at home and abroad. However, recent softness in household consumption and business confidence have been weighing on growth.
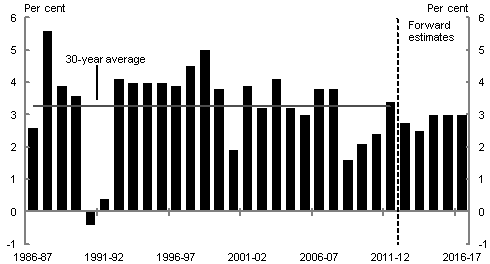
The Australian real economy is expected to grow a little below trend as the transition unfolds, with real GDP expected to increase by 2½ per cent in 2013‑14, rising to 3 per cent in 2014‑15 (Chart 1). Compared with Budget, forecast growth has been revised lower by ¼ of a percentage point in both 2012‑13 and 2013‑14, with weaker household consumption and business investment only partly offset by lower import growth and stronger non‑commodity exports owing to the lower Australian dollar.
Chart 1: Real GDP growth over the forward estimates
Source: ABS cat. no. 5206.0, Treasury.
The outlook for world growth in 2013 has weakened since Budget, with a larger economic contraction and slower recovery now likely in the euro area and more moderate growth expected in emerging Asia, most notably in China and India. Looking forward, the Australian economy is expected to be supported by strengthening global economic growth over the forecast period, as the United States' economy continues to recover, conditions in Europe begin to improve and growth in emerging Asia remains solid. The global economy is now expected to grow by 3 per cent in 2013, recovering to 3¾ per cent in 2014 and 4 per cent in 2015 (Table 3).
| Actuals | Forecasts | ||||
|---|---|---|---|---|---|
| 2012 | 2013 | 2014 | 2015 | ||
| China (b) | 7.8 | 7 1/4 | 7 1/2 | 7 1/2 | |
| India(b) | 3.8 | 5 | 6 1/2 | 6 1/2 | |
| Japan | 1.9 | 1 3/4 | 1 | 1 | |
| United States | 2.8 | 1 1/2 | 2 1/2 | 2 1/2 | |
| Euro area | -0.6 | - 3/4 | 3/4 | 1 1/4 | |
| Other East Asia(c) | 3.9 | 3 3/4 | 4 3/4 | 5 | |
| Major trading partners | 4.1 | 4 | 4 1/2 | 4 3/4 | |
| World | 3.3 | 3 | 3 3/4 | 4 | |
(a) World, euro area, and other East Asia growth rates are calculated using GDP weights based on purchasing power parity (PPP), while growth rates for major trading partners are calculated using export weights.
(b) Production‑based measure of GDP.
(c) Other East Asia comprises the Newly Industrialised Economies (NIEs) of Hong Kong, South Korea, Singapore and Taiwan and the Association of Southeast Asian Nations group of five (ASEAN‑5), which comprises Indonesia, Malaysia, the Philippines, Thailand and Vietnam.
Source: National statistical publications, Thomson Reuters and Treasury.
More moderate growth is now expected for China, with authorities' actions to address financial market risks and promote more sustainable growth expected to result in less accommodative credit conditions than assumed at Budget (Box 1). Concerns around the outlook for economic growth in China have contributed to significant falls in world commodity prices including for Australia's key commodity exports (Chart 2).
Box 1: China in transition
The more moderate growth outlook for China reflects an expectation that recent policy actions to address growing risks in China's financial system will mean a less supportive credit environment than assumed at Budget. While contributing to a more stable and efficient financial system, and hence more sustainable medium‑ to longer‑term growth, tighter credit conditions are likely to weigh on China's economic activity in the near term.
The more moderate growth forecast for 2013 also reflects weaker than anticipated demand for Chinese exports, especially from advanced economies. Still, China's medium term growth potential remains strong, with growing signs that the new government will make the necessary structural reforms to secure this potential. Supported by a modest pick‑up in China's exports to advanced economies, solid growth in China is forecast to underpin strengthening growth among Australia's major trading partners in 2014 and 2015.
Concerns around the outlook for economic growth in China have contributed to significant falls in world commodity prices. The changing composition of growth in China is also expected to place downward pressure on commodity prices, with planned structural reforms to support China's longer term growth prospects expected to encourage a move away from investment led growth, and contribute to a less resource intensive pattern of activity in coming years.
While iron ore and other bulk commodity prices have been volatile, recent developments have prompted a reassessment of the level commodity prices will reach at the end of the forecast period. A softer outlook for Chinese economic growth, increased supply and lower global costs of production have lowered the expected profile of prices for key commodities in US dollars, but the implications for export earnings are partly offset by the lower Australian dollar.
Chart 2: Bulk non‑rural commodity prices
(average unit export prices)
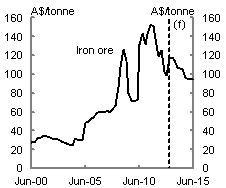
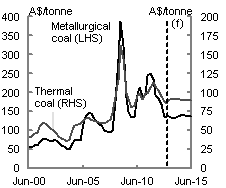
Source: Based on ABS data and Treasury. Export prices differ from the more‑widely quoted spot prices. Export prices reflect the actual price foreigners pay for our exports and reflect the quality of the resource being provided (such as the iron ore content), long‑term contracts, and exchange rate movements.
The terms of trade are expected to fall 5¾ per cent in 2013‑14 and 3¾ per cent in 2014‑15 after declining 10½ per cent in 2012‑13 (Chart 3). The significant revisions to the terms of trade, along with a weaker outlook for wage growth, have led to a substantial downward revision to forecast nominal GDP growth. Wage growth has slowed over the past year, as businesses have adjusted to the ongoing impact of the elevated Australian dollar and other competitive pressures by containing wages and other costs.
Nominal GDP is forecast to grow by 3¾ per cent in 2013‑14 and 4½ per cent in 2014‑15, significantly weaker than at Budget. The implications of this for expected revenue, and the budget bottom line, are discussed in the Fiscal Outlook Part.
Chart 3: Terms of trade
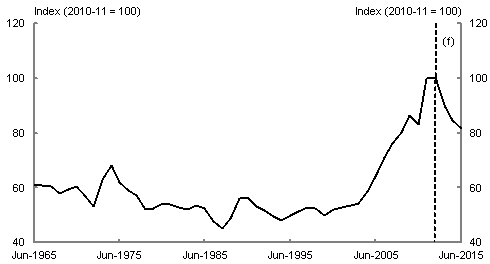
Source: ABS cat. no. 5206.0 and Treasury.
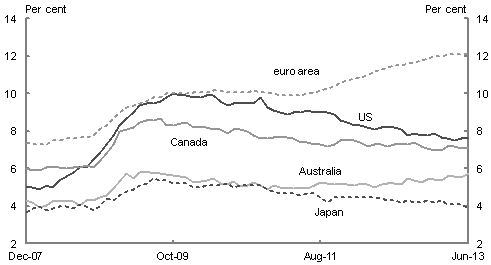
The labour market is expected to remain resilient with slower wage growth, an important mechanism for supporting employment growth in the rest of the economy as the relatively employment‑intensive resources construction phase passes its peak. Nevertheless, the unemployment rate is now expected to reach 6¼ per cent by mid‑2014, owing to lower forecast real GDP growth and the current rate of unemployment being a little higher than expected. The unemployment rate is expected to stabilise at that level in 2014‑15 but remain one of the lowest in the developed world, with many countries still feeling the effects of the global financial crisis (Chart 4).
Chart 4: Unemployment rates
Source: Thomson Reuters, ABS cat. no. 6202.0.
Inflation is expected to remain contained within the RBA's target band. Headline inflation is forecast to be 2½ per cent through the year to the June quarter 2014, slightly stronger than at Budget, reflecting the effect of higher import prices from the lower Australian dollar. Headline inflation is then expected to ease to 2 per cent through the year to the June quarter 2015 owing to the lower forecast carbon price. Underlying inflation is expected to be 2½ per cent through the year to the June quarter of 2014 and 2¼ per cent through the year to the June quarter of 2015.1
The global environment continues to pose significant risks to the outlook, and domestic risks have also become more pronounced since Budget. Internationally, the crisis in the euro area remains unresolved and constitutes the key risk to the global recovery. Elsewhere, the United States will need to face the eventual challenge of unwinding unconventional monetary policy, while uncertainty exists in Japan over whether the authorities will successfully rid Japan of deflation and sustain the economic recovery.
More importantly for Australia, it is still unclear how successful recent actions by Chinese authorities will be in addressing the build‑up of risks in China's financial sector that have accumulated in recent years. Moreover, in taking steps to address these risks, there is a danger that a policy misstep could lead to more extensive, unintended financial market disruptions.
Domestically, the transmission of volatility abroad to commodity prices presents a considerable risk to nominal GDP. In addition, the decline in resources investment following its peak could be more pronounced than expected, and the transition to new drivers of growth may be less than seamless. It is also possible for weak income growth to weigh more heavily on domestic demand than currently expected. That said, Australia confronts these challenges with some of the strongest economic fundamentals in the developed world and is well placed to manage the transition.
Detail of sectoral forecasts for the Australian economy
| Estimate | Forecasts | |||||||
|---|---|---|---|---|---|---|---|---|
| 2012‑13 | 2013‑14 | 2014‑15 | ||||||
| Budget | ES (b) | Budget | ES | Budget | ES | |||
| Panel A - Demand and output(c) | ||||||||
| Household consumption | 2 1/2 | 2 1/2 | 3 | 2 1/2 | 3 | 3 | ||
| Private investment | ||||||||
| Dwellings | 1/2 | 1 1/2 | 5 | 5 | 5 1/2 | 5 1/2 | ||
| Total business investment(d) | 10 1/2 | 6 1/2 | 4 1/2 | 1 1/2 | 1 | - 1/2 | ||
| Non-dwelling construction(d) | 18 1/2 | 14 1/2 | 5 | 1 | -2 1/2 | -4 1/2 | ||
| Machinery and equipment(d) | 1 1/2 | -2 1/2 | 2 1/2 | 1/2 | 5 | 3 | ||
| Private final demand(d) | 4 | 3 1/2 | 3 1/2 | 2 1/4 | 2 3/4 | 2 1/2 | ||
| Public final demand(d) | - 1/2 | -1 1/2 | 0 | 3/4 | 1/2 | 1 | ||
| Total final demand | 3 | 2 1/4 | 2 3/4 | 2 | 2 1/4 | 2 | ||
| Change in inventories(e) | 0 | - 1/4 | 0 | 0 | 0 | 0 | ||
| Gross national expenditure | 3 | 2 | 2 3/4 | 2 | 2 1/4 | 2 | ||
| Exports of goods and services | 7 | 7 | 6 1/2 | 6 1/2 | 7 | 7 | ||
| Imports of goods and services | 5 | 0 | 6 | 4 | 3 | 3 | ||
| Net exports(e) | 1/2 | 1 1/2 | 0 | 1/2 | 1 | 1 | ||
| Gross domestic product | 3 | 2 3/4 | 2 3/4 | 2 1/2 | 3 | 3 | ||
| Non-farm product | 3 | 3 | 2 3/4 | 2 1/2 | 3 1/4 | 3 | ||
| Farm product | -8 | -6 | 4 | 4 | 0 | 1 | ||
| Nominal gross domestic product | 3 1/4 | 2 1/2 | 5 | 3 3/4 | 5 | 4 1/2 | ||
| Panel B - Other selected economic measures | ||||||||
| External accounts | ||||||||
| Terms of trade | -7 1/2 | -10 1/2 | - 3/4 | -5 3/4 | -1 3/4 | -3 3/4 | ||
| Current account balance (per cent of GDP) | -3 1/2 | -3 | -3 3/4 | -3 3/4 | -3 1/4 | -3 3/4 | ||
| Labour market | ||||||||
| Employment (labour force survey basis)(f) | 1 1/4 | 1.3 | 1 1/4 | 1 | 1 1/2 | 1 1/2 | ||
| Unemployment rate (per cent)(g) | 5 1/2 | 5.6 | 5 3/4 | 6 1/4 | 5 3/4 | 6 1/4 | ||
| Participation rate (per cent)(g) | 65 | 65.3 | 65 | 65 1/4 | 65 | 65 1/4 | ||
| Prices and wages | ||||||||
| Consumer Price Index (h) | 2 1/2 | 2.4 | 2 1/4 | 2 1/2 | 2 1/4 | 2 | ||
| Gross non-farm product deflator | 0 | - 1/2 | 2 | 1 1/4 | 1 3/4 | 1 1/4 | ||
| Wage Price Index(f) | 3 1/2 | 3 1/4 | 3 1/2 | 3 1/4 | 3 1/2 | 3 1/4 | ||
(a) Percentage change on preceding year unless otherwise indicated.
(b) Employment growth, the unemployment rate, the participation rate and the consumer price index are ABS outcomes.
(c) Chain volume measures except for nominal gross domestic product, which is in current prices.
(d) Excluding second‑hand asset sales from the public sector to the private sector.
(e) Percentage point contribution to growth in GDP.
(f) Seasonally adjusted, through the year growth rate to the June quarter.
(g) Seasonally adjusted, estimate for the June quarter.
(h) Through the year growth rate to the June quarter.
Note: The domestic economy forecasts are based on several technical assumptions. The exchange rate is assumed to remain around its recent average level — a trade weighted index of 71 and a United States dollar exchange rate of around 92 US cents. Interest rates are assumed to move broadly in line with market expectations. Oil prices (Malaysian Tapis) are assumed to remain around US$114 per barrel. The farm sector forecasts are based on an assumption of average seasonal conditions.
Source: ABS cat. nos. 5206.0, 5302.0, 6202.0, 6345.0, 6401.0, unpublished ABS data and Treasury.
1 The move to a floating carbon price in 2014‑15 is expected to lower headline inflation by around ½ of a percentage point and underlying inflation by less than ¼ of a percentage point through the year to the June quarter 2015. The staged increases in tobacco excise (see Fiscal Outlook chapter) are expected to raise headline inflation by less than ¼ of a percentage point through the year to both the June quarter 2014 and 2015, and leave underlying inflation unchanged.
Note: Where possible, Budget documents are available in HTML and for downloading in Portable Document Format(PDF). If you require further information on any of the tables or charts on this website, please contact The Treasury.
