


Statement 2 (continued)
Medium‑term projections
The budget forward estimates contain economic forecasts for the budget year and the subsequent financial year, and projections for the next two financial years. These projections are not forecasts, but rather are based on a set of medium‑term assumptions.
In previous Budgets, and MYEFOs prior to 2013‑14, real GDP was projected to grow at its estimated trend rate, and the unemployment rate was assumed to immediately return to 5 per cent, Treasury's estimate of the non‑accelerating inflation rate of unemployment (NAIRU). In times when the degree of spare capacity in the economy was small, and the unemployment rate was close to the NAIRU, this approach had significant merit.
However, as flagged at MYEFO and subsequently, these medium‑term assumptions have been revisited to consider whether they remain appropriate in the face of a large and rising level of spare capacity in the economy. In the 2013 PEFO, an alternative assumption of above trend growth and gradually declining unemployment was presented for the projection years, recognising that the economy would be operating with spare capacity by the end of the forecast period. In the 2013‑14 MYEFO, real GDP in the two projection years was assumed to grow at its trend rate, and unemployment was maintained at its rate at the end of the forecast period, 6¼ per cent. If this approach had been maintained over the years beyond the forward estimates, it would have been akin to assuming the spare capacity was permanent — meaning real GDP would never return to trend levels and unemployment would remain permanently above the NAIRU.
Based on current forecasts, by the end of 2015‑16, the economy will have grown slower than trend for seven of the past eight years. As a result, it is estimated that the economy will be operating at that time with a gap between potential output and actual output of about 2 per cent (Chart 12) — the largest such output gap since the mid‑1990s.
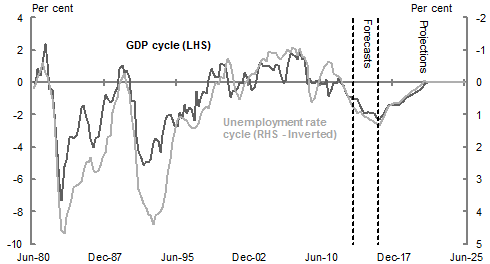
Source: Treasury.
Building on the revised assumptions made in MYEFO, Treasury has reviewed the projection methodology with the aim of incorporating a path of adjustment that closes this gap over the medium term. The 2014‑15 Budget adopts a new framework, which assumes that the spare capacity is absorbed over the five years following the two‑year forecast period. This new framework is laid out in Treasury Working Paper 2014‑02.3
Under this framework, real GDP returns to its trend level by 2020‑21. As this occurs, labour market variables, including employment and the participation rate, converge from their levels at the end of the forecast period to their long‑run trend levels.
With spare capacity at the end of the forecast period, real GDP is projected to grow above trend for a period of five years from 2016‑17. Real GDP growth over this period is therefore stronger than projected at MYEFO.
However, the level of output remains below potential over these years, resulting in projected wage growth that is weaker than at MYEFO. The extended period of below‑trend wage growth helps to facilitate sufficient employment growth to transition unemployment gradually back to the NAIRU. In turn, weaker wage costs are projected to flow through to subdued prices growth, with correspondingly slower growth in the GDP deflator, and hence in nominal GDP.
Over the projection period, as a result of the revised methodology nominal GDP is higher, with stronger real GDP growth only partially offset by a lower GDP deflator, the number of unemployment benefit recipients is lower and growth in wage‑indexed payments is slower. Compared with MYEFO, the revised projection methodology results in a reduction in the underlying cash balance of $0.3 billion (0.02 per cent of GDP) in 2016‑17 and an increase of $0.9 billion (0.05 per cent of GDP) in 2017‑18. By 2024-25, the new methodology increases the underlying cash balance by $3.4 billion (0.12 per cent of GDP).
3 http://www.treasury.gov.au/PublicationsAndMedia/Publications/2014/Tsy-Medium-Term-Projection.