


Statement 3 (continued)
Fiscal strategy
The Government's fiscal strategy
In this Budget, the Government outlines its fiscal strategy, consistent with the requirements of the Charter of Budget Honesty Act 1998 (See Box 1).
Box 1: The Government's fiscal strategy
Medium‑term fiscal strategy
The Government's medium‑term fiscal strategy is to achieve budget surpluses, on average, over the course of the economic cycle.
Our strategy is underpinned by the following three policy elements:
- investing in a stronger economy by redirecting Government spending to quality investment to boost productivity and workforce participation;
- maintaining strong fiscal discipline to reduce the Government's share of the economy over time in order to free up resources for private investment to drive jobs and economic growth, with:
- the payments‑to‑GDP ratio falling;
- paying down debt by stabilising and then reducing Commonwealth Government Securities on issue over time; and
- strengthening the Government's balance sheet by improving net financial worth over time.
Budget repair strategy
The Budget repair strategy is designed to deliver budget surpluses building to at least 1 per cent of GDP by 2023‑24 consistent with the medium‑term fiscal strategy.
Our strategy sets out that:
- new spending measures will be more than offset by reductions in spending elsewhere within the budget;
- the overall impact of shifts in receipts and payments due to changes in the economy will be banked as an improvement to the budget bottom line, if this impact is positive; and
- a clear path back to surplus is underpinned by decisions that build over time.
The Budget repair strategy will stay in place until a strong surplus is achieved and so long as economic growth prospects are sound and unemployment remains low.
Delivering on the medium‑term fiscal strategy
In the 2014‑15 Budget, the Government has put the Budget on a far more sustainable footing consistent with the medium‑term fiscal strategy.
Budget surpluses over the course of the economic cycle
This Budget enables the Government to deliver a substantial reduction of $43.8 billion in the underlying cash deficit since the 2013‑14 MYEFO over the four years to 2017‑18. The deficits at the 2013‑14 MYEFO for the four years to 2017‑18 totalled $104.1 billion, using the medium‑term projection for 2017‑18 of a deficit of $28.4 billion. The deficits over the same period in the 2014‑15 Budget total $60.2 billion.
The headline annual pace of consolidation is 0.7 per cent of GDP over the forward estimates. Abstracting from the one‑off nature of the Reserve Bank of Australia transaction, the pace of consolidation is 0.6 per cent of GDP. This pace of consolidation over the forward estimates strikes the right balance between the impact of fiscal consolidation on the economy and sustainable structural reforms.
Beyond the forward estimates the savings measures in this Budget are expected to grow, contributing to a substantial improvement in the fiscal position.
Chart 2 shows the projected underlying cash balance under two scenarios. The no tax cap scenario allows the average tax rates to increase above the long‑term average. If fiscal drag, including income tax bracket creep, is allowed to occur indefinitely then a rising personal income tax burden would also have negative impacts on workforce participation. This potential reduction in GDP growth has not been taken into account.
The tax cap scenario assumes that taxes are not allowed to grow beyond the average of 23.9 per cent of GDP.
In the tax cap scenario, the budget is projected to be at balance in 2018‑19, and in a strong surplus of 1.4 per cent of GDP in 2024‑25, delivering on the election commitment for surpluses to build to at least 1 per cent of GDP by 2023‑24.
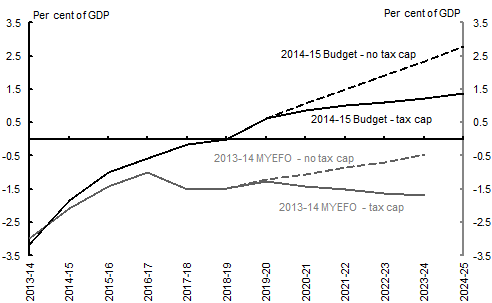
Note: The underlying cash balance excludes Future Fund earnings and payments. MYEFO tax cap projection was not published at MYEFO.
Source: Treasury projections.
These projections are based on a further 10 years of uninterrupted economic growth. Such an outcome would take our record to 34 consecutive years of growth by 2024‑25, a record unparalleled amongst advanced economies.
These projections do not assume a cap on real spending growth to achieve budget surpluses. Instead, the substantial improvement to the bottom line is built on a significant reduction in payments growth as a result of the Government's long‑term budget savings.
In the tax cap scenario, average annual real payments growth over the medium term (the period from 2018‑19 to 2024‑25) falls to 2.7 per cent, compared to 3.7 per cent projected at the 2013‑14 MYEFO. The payments‑to‑GDP ratio declines from 25.3 per cent of GDP in 2014‑15 to 24.2 per cent in 2024‑25, falling below the long‑term average2 as shown in Chart 3.
Total payments in the no tax cap scenario are lower than in the tax cap scenario because additional tax receipts reduce the issuance requirement for Commonwealth Government Securities and thereby lower public debt interest payments.
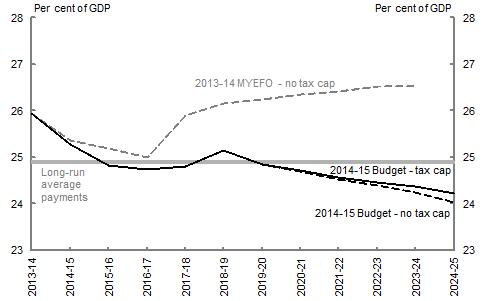
Note: Total payments include Future Fund payments. MYEFO tax cap projection was not published at MYEFO.
Source: Treasury projections.
Chart 4 shows that in the scenario with no tax cap, tax receipts are projected to increase from 22.1 per cent of GDP in 2014‑15 to 25.1 per cent in 2024‑25.
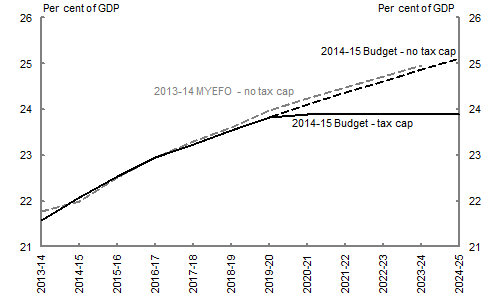
Note: Tax receipts make up the bulk, but not all, of total receipts. Non‑tax receipts make up around 1.5 per cent of GDP.
Source: Treasury projections.
Investing in a stronger economy by redirecting government spending
A key element of the fiscal strategy is investing in a stronger economy by redirecting government spending to quality investments to boost productivity and participation.
To drive the productivity required to generate economic growth, the Government has refocused spending on infrastructure and reforms to higher education.
The Infrastructure Growth Package will provide additional infrastructure spending of $11.6 billion to address critical transport bottlenecks. This investment will take the Government's total investment in transport infrastructure to $50 billion by 2019‑20. Total infrastructure investment from Commonwealth, State and local governments, as well as the private sector, will build to over $125 billion of additional infrastructure.
The Infrastructure Growth Package is designed to support economic growth in the short term and the economy's longer term productive capacity.
Strong fiscal discipline
The Government's fiscal strategy reflects a commitment to maintain the strong fiscal discipline required to pay down debt. This is a necessary part of reducing the Government's share of the economy over time in order to free up resources for private investment to drive jobs and economic growth, and live within our means.
The Government has begun the task of reducing the payments‑to‑GDP ratio which falls from 25.3 per cent of GDP in 2014‑15 to 24.7 per cent of GDP in 2016‑17, before returning to 24.8 per cent of GDP in 2017‑18.
The Government recognises that this is only the first step in repairing the Budget and that there is further work to do.
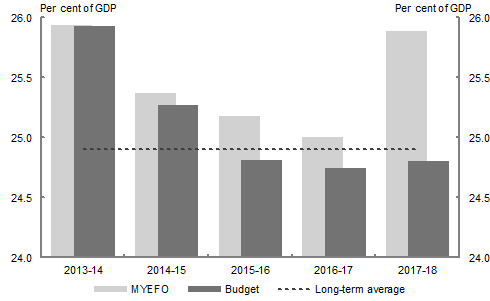
The slight rise in the payments‑to‑GDP ratio in 2017‑18 occurs despite the Government's decisions that reduce government spending by $15.5 billion. The real growth in payments inherited in 2017‑18 was 5.9 per cent. Without action, the growth in payments in 2017‑18 would have been $38.0 billion, payments‑to‑GDP in 2017‑18 would have been 25.9 per cent of GDP, and would have resulted in a deficit of $28.4 billion. The Government's decisions have reduced this real growth to 2.6 per cent and a deficit of $2.8 billion.
By 2024‑25, the payments‑to‑GDP ratio is projected to reduce to 24.2 per cent of GDP. This is below the long term average of 24.9 per cent of GDP. A falling payments‑to‑GDP ratio will mean that the Government will be better placed to lower taxes.
The Government will achieve fiscal consolidation through medium‑term structural savings to the budget. These savings decisions will help to improve the sustainability and efficiency of Government spending. The largest savings beyond the forward estimates are through:
- changes to welfare payments for young people with full working capacity;
- changes to the funding of the Official Development Assistance programme;
- reforms to hospital funding and health expenditure, including new patient contributions to the costs of medical services;
- reforms to schools funding to drive efficient delivery of education services;
- changes to family tax benefits, including tightening of eligibility requirements;
- changes to the method of indexation of age and disability pensions; and
- reforms to higher education funding and student contributions.
In the scenario with a tax cap, Commonwealth Government Securities on issue in 2023‑24 are expected to be $389 billion, compared to $748 billion if a tax cap had been in place at the 2013‑14 MYEFO as shown in Chart 6.
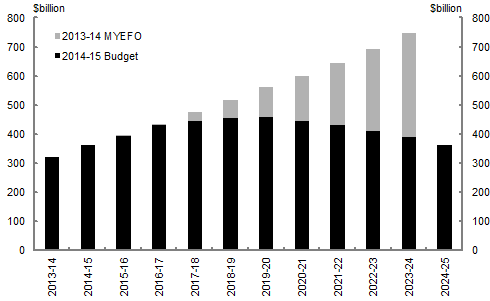
Note: A tax‑to‑GDP cap of 23.9 per cent has been applied on these projections. MYEFO tax cap projection was not published at MYEFO.
Source: Australian Office of Financial Management and Treasury projections.
In the scenario with no tax cap, Commonwealth Government Securities on issue in 2023‑24 are expected to reach $326 billion, compared to $667 billion at the 2013‑14 MYEFO as shown in Chart 7.
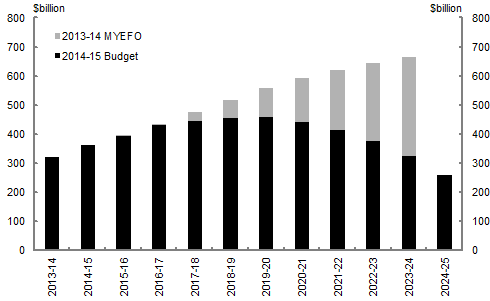
Source: Australian Office of Financial Management and Treasury projections.
Further details on debt reduction can be found in Statement 7: Debt Statement, Assets and Liabilities.
Strengthening the Government's balance sheet
Improving net financial worth over time, and stabilising and then reducing government debt will generate a stronger Commonwealth balance sheet and help to ensure ongoing fiscal sustainability. Returning the budget to surplus is a key part of achieving this outcome.
A strong balance sheet provides the Government the flexibility to respond to unanticipated events during times of financial crises or economic shocks. It can also provide flexibility in facilitating economic reform, address shortfalls in infrastructure investment and respond to structural changes in the economy, such as the ageing population.
Strengthening the Government's balance sheet means that government debt is kept at manageable levels, which reduces the interest cost burden. This has the benefit of more stable tax and spending policies and ensures future generations do not have to bear the burden of restoring weak finances.
Some key aggregates that provide indications of fiscal sustainability are net financial worth, net debt, net worth, and net interest payments set out in Table 2. Net financial worth is the primary indicator of fiscal sustainability articulated in the medium‑term fiscal strategy. It provides a broader measure of the Government's assets and liabilities as it includes both the full assets of the Future Fund and the superannuation liability that the Future Fund is intended to offset.
| Estimates | Projections | |||||
|---|---|---|---|---|---|---|
| 2013‑14 $b |
2014‑15 $b |
2015‑16 $b |
2016‑17 $b |
2017‑ 18$b | ||
| Financial assets | 279.8 | 297.4 | 322.6 | 361.1 | 380.8 | |
| Non-financial assets | 113.2 | 117.2 | 119.9 | 122.0 | 125.3 | |
| Total assets | 393.0 | 414.6 | 442.5 | 483.2 | 506.1 | |
| Total liabilities | 579.4 | 626.6 | 665.0 | 712.2 | 733.4 | |
| Net worth | -186.4 | -212.0 | -222.5 | -229.0 | -227.4 | |
| Net financial worth(a) | -299.6 | -329.2 | -342.4 | -351.0 | -352.7 | |
| Per cent of GDP | -18.9 | -20.2 | -20.0 | -19.6 | -18.7 | |
| Net debt(b) | 197.9 | 226.4 | 246.4 | 261.3 | 264.2 | |
| Per cent of GDP | 12.5 | 13.9 | 14.4 | 14.6 | 14.0 | |
| Net interest payments | 10.7 | 10.5 | 11.5 | 12.2 | 12.9 | |
| Per cent of GDP | 0.7 | 0.6 | 0.7 | 0.7 | 0.7 | |
(a) Net financial worth equals total financial assets minus total liabilities.
(b) Net debt equals the sum of deposits held, government securities, loans and other borrowing, minus the sum of cash and deposits, advances paid and investments, loans and placements.
Net financial worth is estimated to be ‑$329.2 billion (‑20.2 per cent of GDP) in 2014‑15, $6.0 billion worse than estimated at the 2013‑14 MYEFO.
This deterioration reflects a downward revaluation of superannuation liabilities, and a fall in the value of the Government's investments in public sector entities. These negative impacts are partially offset by the higher value of investments held by the Government in newly established funds and other deposits. In 2016‑17, net financial worth is projected to improve by $10.4 billion since the 2013‑14 MYEFO. By 2017‑18, it is projected to start stabilising at around ‑$352.7 billion. Net financial worth improves as a share of GDP, falling from ‑20.2 per cent of GDP in 2014‑15 to ‑18.7 per cent of GDP in 2017‑18.
Net worth is expected to be ‑$212.0 billion in 2014‑15, $5.0 billion worse than estimated at the 2013‑14 MYEFO. Net worth is expected to be ‑$227.4 billion by the end of the forward estimates.
Net debt is estimated to be $226.4 billion in 2014‑15 (13.9 per cent of GDP). As the definition of net debt does not include superannuation liabilities or equity investments (which drive the fall in net financial worth), net debt has improved by $4.7 billion in 2014‑15 compared to the 2013‑14 MYEFO. Net debt is expected to be $264.2 billion by the end of the forward estimates.
In the medium term under the tax cap scenario, net debt is projected to decline to 0.7 per cent of GDP in 2024‑25 as shown in Chart 8. Given the fall in Commonwealth Government Securities on issue, net financial worth is also expected to improve over the medium term.
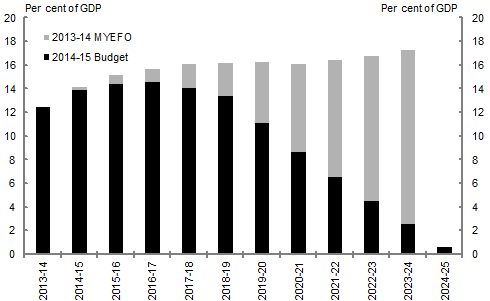
Note: A tax‑to‑GDP cap of 23.9 per cent has been applied on these projections. MYEFO tax cap projection was not published at MYEFO.
Source: Treasury projections.
The Government is determined to reduce the impact that servicing debt has on the budget. In the tax cap scenario, net interest payments are expected to peak at $13.1 billion in 2018‑19 and decline to $6.6 billion in 2024‑25 (0.2 per cent of GDP) as shown in Chart 9. In 2023‑24, net interest payments would reduce from the 2013‑14 MYEFO projection of $31.5 billion to $8.3 billion in this Budget. This is a reduction in net interest costs of $23.2 billion. With a AAA credit rating, Australia faces a relatively low cost of borrowing.
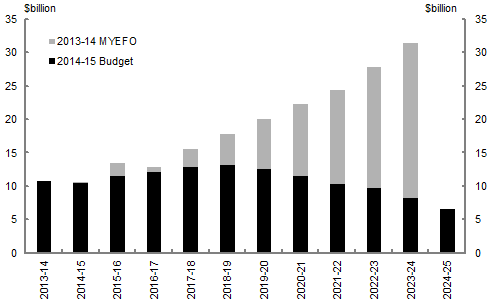
Note: Net interest payment is total interest receipts minus total interest payments. A tax‑to‑GDP cap of 23.9 per cent has been applied to these projections.
Source: Treasury projections.
Further details on debt interest costs can be found within Statement 7: Debt Statement, Assets and Liabilities.
Delivering on the budget repair strategy
The 2014‑15 Budget drives the budget repair strategy that is designed to deliver budget surpluses building to at least 1 per cent of GDP by 2023‑24.
All new decisions taken in this Budget have been more than fully offset, contributing to a clear path back to surplus. The Government has not used estimates variations from increased receipts or decreased payments to fund new spending.
The net budget impact of policy decisions is a $36.0 billion improvement to the underlying cash balance over the forward estimates to 2017‑18. Over the same period, net increases in receipts from policy decisions have improved the underlying cash balance by $8.3 billion, while net savings from payments have improved the underlying cash balance by $27.7 billion. Of the decisions taken in this Budget, 77 per cent of the improvement to the bottom line is the result of reductions to spending.
As a result of decisions, receipts have increased by $8.9 billion over the forward estimates period to 2017‑18, offset by decreases in receipts of $0.6 billion. Increases in receipts are as a result of decisions taken to repair the budget by introducing a temporary levy on individuals' incomes above $180,000 and removing poorly targeted tax concessions. In addition, receipts are increased by the reintroduction of the indexation of fuel excise rates which will be used to fund roads.
The Government has made $47.7 billion in savings from payments in this Budget over the forward estimates to 2017‑18, to pay for new spending of $20.0 billion. The impact of these savings decisions builds over time, reducing payments growth, consistent with the policy to repair the Budget.
Real growth in payments is estimated to be ‑1.7 per cent in 2014‑15, 0.4 per cent in 2015‑16, 2.1 per cent in 2016‑17 and 2.6 per cent in 2017‑18. Over the four years to 2017‑18, the average real growth in payments in the 2014‑15 Budget of 0.8 per cent more than halves the average at the 2013‑14 MYEFO of 1.9 per cent.
In the 2017‑18 year, the Government has taken significant decisions to address increasing program costs, with savings from payments totalling $20.3 billion. This has reduced real payments growth between 2016‑17 and 2017‑18 from 5.9 per cent at the 2013‑14 MYEFO to 2.6 per cent in this Budget. These structural savings decisions build over time and are instrumental in restoring the budget to a more sustainable position over the medium term.
2 The long-term average payments-to-GDP ratio is 24.9 per cent of GDP, calculated over a 30 year period from 1983-84 to 2012‑13.