


Budget Paper 1 — Statement 4 - Chart Data
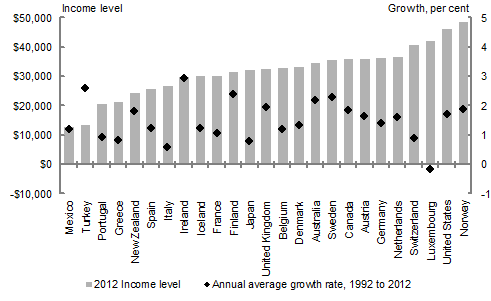
Note: Annual average growth refers to the growth rate in income, measured in 2005 international dollars weighted by purchasing power, from 1992 to 2012. Data for New Zealand are from 1991 to 2011.
Source: World Bank.
The chart shows both absolute and annual average growth in GNI per capita of OECD countries between 1992 and 2012, expressed in 2005 international dollars weighted for purchasing power parity. Australia’s national income per capita, measured in this way, grew by 12,033 dollars, at an annual average rate of 2.17 per cent. These figures place Australia amongst the top nations for the period.
| 2012 Income level | Annual average growth, 1992 to 2012 | |
|---|---|---|
| Mexico | $12,840 | 1.20 |
| Turkey | $13,626 | 2.59 |
| Portugal | $20,541 | 0.91 |
| Greece | $21,379 | 0.83 |
| New Zealand | $24,320 | 1.80 |
| Spain | $25,789 | 1.24 |
| Italy | $26,747 | 0.59 |
| Ireland | $29,711 | 2.93 |
| Iceland | $30,190 | 1.24 |
| France | $30,327 | 1.05 |
| Finland | $31,574 | 2.38 |
| Japan | $32,390 | 0.78 |
| United Kingdom | $32,425 | 1.94 |
| Belgium | $32,767 | 1.21 |
| Denmark | $33,273 | 1.33 |
| Australia | $34,464 | 2.17 |
| Sweden | $35,811 | 2.27 |
| Canada | $36,067 | 1.85 |
| Austria | $36,123 | 1.65 |
| Germany | $36,286 | 1.41 |
| Netherlands | $36,805 | 1.61 |
| Switzerland | $40,636 | 0.89 |
| Luxembourg | $42,266 | -0.18 |
| United States | $46,084 | 1.72 |
| Norway | $48,522 | 1.86 |
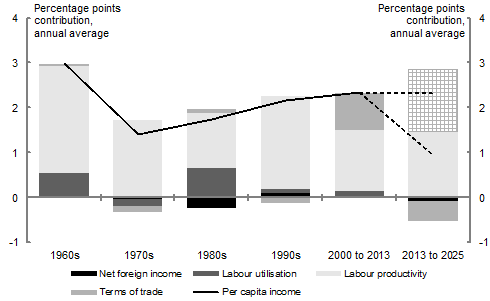
Note: Contributions to income growth in the period 2013 to 2025 are consistent with the forecasts and projections detailed in Budget Statement 2. The hatched area represents the additional labour productivity growth required to achieve long run average growth in real gross national income per capita.
Source: ABS 5204.0 and Treasury.
The chart shows real Gross National Income growth decomposed into its source (net foreign income, labour productivity, labour utilisation, terms of trade) spanning the 1960s, 70s, 80s, 90s, the period from 2000 to 2013 and the decade to 2023. Although other factors have had some influence in certain decades, notably the terms of trade in the period from 2000 to 2013, labour productivity has been the key driver of growth in income per capita.
| Titles for charts | Labour utilisation | Per capita income | Net foreign income | Terms of trade | Labour productivity |
Growth in GNI per person | Labour productivity growth to achieve 30 year average GNI growth |
Difference | ||
|---|---|---|---|---|---|---|---|---|---|---|
| Future Scenario 1 |
Future Scenario 2 | |||||||||
| first year |
last year |
Hours index/pop |
RGNI/pop | RGNI/RGDI | RGDI/RGDP | RGDP/ Hours index |
RGNI/ pop |
RGDP/ Hours index |
||
| 1960s | Jun‑61 | Jun‑70 | 0.56 | 2.98 | 0.00 | 0.06 | 2.36 | 2.98 | 2.36 | 0.00 |
| 1970s | Jun‑71 | Jun‑80 | -0.17 | 1.41 | -0.02 | -0.14 | 1.73 | 1.41 | 1.73 | 0.00 |
| 1980s | Jun‑81 | Jun‑90 | 0.66 | 1.75 | -0.23 | 0.10 | 1.22 | 1.75 | 1.22 | 0.00 |
| 1990s | Jun‑91 | Jun‑00 | 0.09 | 2.15 | 0.11 | -0.11 | 2.07 | 2.15 | 2.07 | 0.00 |
| 2000‑2013 | Jun‑01 | Jun‑13 | 0.10 | 2.33 | 0.04 | 0.83 | 1.37 | 2.33 | 1.37 | 0.00 |
| 2013‑2025 | Jun‑14 | Jun‑25 | 0.03 | 0.94 | -0.07 | -0.46 | 1.44 | 2.32 | 2.82 | 1.38 |
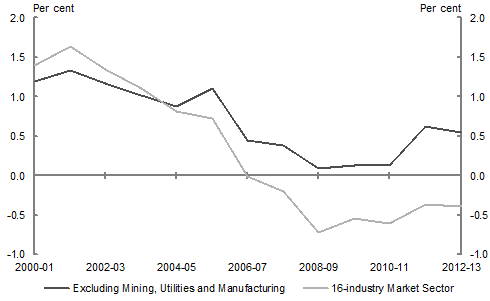
Note: Data are 5-year period-end moving averages.
Source: ABS 5260.0.55.002, unpublished ABS data and Treasury calculations.
This chart shows that five year average multifactor productivity growth in the 16-industry market sector has declined significantly over the course of the 2000s to date, and has been negative since 2007-08. When the impact of the mining, utilities and manufacturing industries are removed from the data, multifactor productivity growth has still slowed significantly since the early 2000s, indicating the slowdown in multifactor productivity growth in Australia has been broad-based across industries.
| Excluding Mining, Utilities and Manufacturing | 16-industry Market Sector | |
|---|---|---|
| 2000-01 | 1.19 | 1.40 |
| 2001-02 | 1.34 | 1.64 |
| 2002-03 | 1.17 | 1.35 |
| 2003-04 | 1.02 | 1.11 |
| 2004-05 | 0.88 | 0.81 |
| 2005-06 | 1.10 | 0.72 |
| 2006-07 | 0.45 | 0.00 |
| 2007-08 | 0.39 | -0.20 |
| 2008-09 | 0.09 | -0.71 |
| 2009-10 | 0.13 | -0.54 |
| 2010-11 | 0.13 | -0.61 |
| 2011-12 | 0.63 | -0.36 |
| 2012-13 | 0.55 | -0.39 |
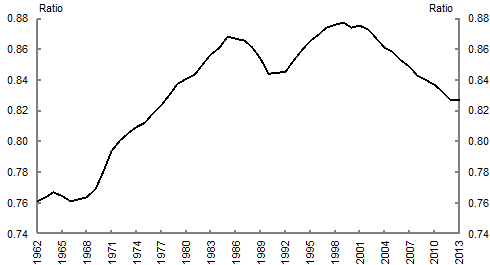
Note: Data are a 5-year period-end moving average.
Source: The Conference Board Total Economy Database and Treasury.
The chart shows the ratio of Australian to US labour productivity levels from 1962 to 2013. Australia’s labour productivity rose from around 84 per cent of the US level in 1990 to around 88 per cent at the turn of the century. Since then, it has fallen to around 83 per cent of the US level.
| Labour productivity ratio - Australia to US | |
|---|---|
| 1960 | 0.76 |
| 1961 | 0.76 |
| 1962 | 0.76 |
| 1963 | 0.76 |
| 1964 | 0.77 |
| 1965 | 0.76 |
| 1966 | 0.76 |
| 1967 | 0.76 |
| 1968 | 0.76 |
| 1969 | 0.77 |
| 1970 | 0.78 |
| 1971 | 0.79 |
| 1972 | 0.80 |
| 1973 | 0.81 |
| 1974 | 0.81 |
| 1975 | 0.81 |
| 1976 | 0.82 |
| 1977 | 0.82 |
| 1978 | 0.83 |
| 1979 | 0.84 |
| 1980 | 0.84 |
| 1981 | 0.84 |
| 1982 | 0.85 |
| 1983 | 0.86 |
| 1984 | 0.86 |
| 1985 | 0.87 |
| 1986 | 0.87 |
| 1987 | 0.87 |
| 1988 | 0.86 |
| 1989 | 0.85 |
| 1990 | 0.84 |
| 1991 | 0.84 |
| 1992 | 0.85 |
| 1993 | 0.85 |
| 1994 | 0.86 |
| 1995 | 0.87 |
| 1996 | 0.87 |
| 1997 | 0.87 |
| 1998 | 0.88 |
| 1999 | 0.88 |
| 2000 | 0.87 |
| 2001 | 0.88 |
| 2002 | 0.87 |
| 2003 | 0.87 |
| 2004 | 0.86 |
| 2005 | 0.86 |
| 2006 | 0.85 |
| 2007 | 0.85 |
| 2008 | 0.84 |
| 2009 | 0.84 |
| 2010 | 0.84 |
| 2011 | 0.83 |
| 2012 | 0.83 |
| 2013 | 0.83 |