


Budget Paper 1 — Statement 6
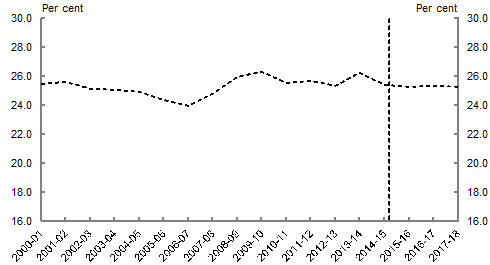
This chart shows total Australian Government general government sector expenses, as a per cent of GDP, from 2000-01 to 2017-18. Over the last seven years, total expenditure rose as a percentage of GDP from 24.8 per cent in 2007-08 to a forecast 26.2 per cent in 2013-14. Over the forward estimates, expenses are expected to decline to 25.3 per cent of GDP in 2017-18.
| Financial Year | Proportion of GDP (Per Cent) |
|---|---|
| 2000-01 | 25.48 |
| 2001-02 | 25.57 |
| 2002-03 | 25.13 |
| 2003-04 | 25.06 |
| 2004-05 | 24.89 |
| 2005-06 | 24.34 |
| 2006-07 | 23.93 |
| 2007-08 | 24.80 |
| 2008-09 | 25.92 |
| 2009-10 | 26.29 |
| 2010-11 | 25.50 |
| 2011-12 | 25.70 |
| 2012-13 | 25.30 |
| 2013-14 | 26.23 |
| 2014-15 | 25.42 |
| 2015-16 | 25.22 |
| 2016-17 | 25.30 |
| 2017-18 | 25.25 |
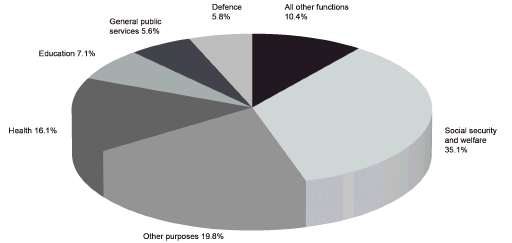
This chart shows the proportion of total Australian Government general government sector expenses by function in 2014-15. Around one third of total expenses is spent on programmes within the social security and welfare function, and another one sixth of government expenses is spent on programmes within the health function. The Government also provides significant investment under the education and defence functions, with the remainder spent on a range of other public services.
| Function | Expense (per cent) |
|---|---|
| Social security and welfare | 35 |
| Other purposes | 20 |
| Health | 16 |
| Education | 7 |
| General public services | 6 |
| Defence | 6 |
| All other functions | 10 |
(a) The other purposes function is not included in this chart as it contains expenses for general revenue assistance to the State and Territory governments (primarily GST), public debt interest, and the conservative bias allowance.
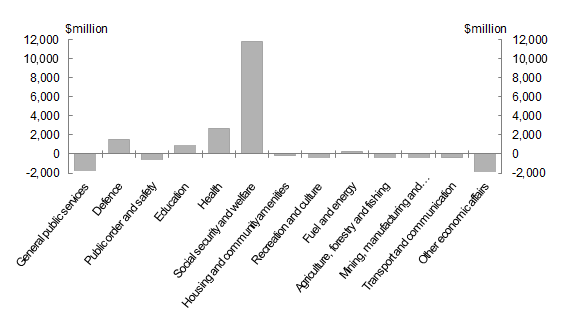
This chart shows total real growth, in $millions, by function over the period 2014-15 to 2017-18. Social security and welfare expenses are estimated to grow strongly over the forward estimates, followed by growth in the health, defence, education and fuel and energy functions. All other functions are estimated to have negative real growth over this period.
| Function | $ million |
|---|---|
| General public services | -1,775 |
| Defence | 1,468 |
| Public order and safety | -627 |
| Education | 901 |
| Health | 2,636 |
| Social security and welfare | 11,742 |
| Housing and community amenities | -93 |
| Recreation and culture | -407 |
| Fuel and energy | 220 |
| Agriculture, forestry and fishing | -367 |
| Mining, manufacturing and construction | -414 |
| Transport and communication | -348 |
| Other economic affairs | -1,860 |