

Part 2: Economic Outlook (continued)
International economic outlook
World economic growth is expected to pick up over the forecast horizon, but not to the extent forecast at Budget. Growth remains uneven, with the recovery in advanced economies being patchy. While emerging market economies have slowed in 2015, their growth is expected to pick up in 2016 and 2017. More than 70 per cent of world growth is expected to come from emerging market economies, predominantly those within the Asia‑Pacific region.
Australia's major trading partner growth is expected to continue to exceed world growth at 4 per cent in 2015, 2016 and 2017. This reflects the relative strength of East Asian economies and the importance of this region as a destination for Australia's exports.
Risks to the global outlook are elevated, with the world economy struggling to regain sustained momentum. The significant transitions underway in the global economy, while welcome, may not be smooth. China's shift from investment‑led growth to a greater reliance on consumption and services has implications for regional and global activity, while also presenting new opportunities for Australian businesses.
The prospect of normalisation of US monetary policy from near‑zero interest rates has the potential to contribute to financial market volatility. Emerging market economies have accumulated large amounts of debt in recent years and could be exposed to sudden shifts in market sentiment. Financial market volatility was pronounced through the middle of the year and there is potential for further episodes.
Since the Budget, commodity prices have continued to fall reflecting both increasing supply and slowing demand growth. Both oil and iron ore spot prices have fallen by around a third since Budget in US dollar terms, while thermal coal and metallurgical coal spot prices have fallen by around 15 per cent and 10 per cent respectively. Lower commodity and oil prices are, on balance, likely to support global growth, despite being a drag on the economies of oil and commodity exporters.
Global inflation pressures remain weak, with the fall in oil prices over the past year suppressing headline inflation. Core inflation pressures (excluding food and energy) also remain weak in most major economies. Additionally, market expectations of medium and longer‑term inflation have fallen in the major advanced economies. Against this background, global monetary policy remains very accommodative.
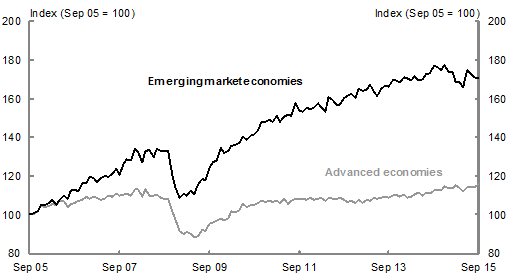
A further sign that the global economy is struggling to regain sustained momentum is slower growth in global trade, which is particularly evident in export‑focused East Asian economies. So far in 2015, world merchandise trade volumes have expanded at their slowest rate since 2009, driven by a slowdown in emerging market economies (Chart 2.1). There are a number of factors contributing to slower global trade growth, including the shifting composition of China's growth.
| Month-Year | Advanced Economies | Emerging market economies |
|---|---|---|
| Sep-05 | 100 | 100 |
| Oct-05 | 100.4783114 | 100.786 |
| Nov-05 | 101.6646069 | 102.097 |
| Dec-05 | 104.5795548 | 104.8651 |
| Jan-06 | 103.9303042 | 105.0161 |
| Feb-06 | 104.354912 | 105.9993 |
| Mar-06 | 105.6724573 | 107.5108 |
| Apr-06 | 105.0658026 | 104.9698 |
| May-06 | 107.189466 | 107.5521 |
| Jun-06 | 107.2658354 | 110.1639 |
| Jul-06 | 103.9576941 | 108.386 |
| Aug-06 | 105.6058941 | 112.681 |
| Sep-06 | 106.2533123 | 112.9569 |
| Oct-06 | 107.2267508 | 112.1173 |
| Nov-06 | 107.9376859 | 116.6073 |
| Dec-06 | 109.2996001 | 116.1386 |
| Jan-07 | 108.5091296 | 119.3671 |
| Feb-07 | 109.503415 | 118.8404 |
| Mar-07 | 108.7661649 | 116.9484 |
| Apr-07 | 107.8158575 | 118.8799 |
| May-07 | 108.4648013 | 119.8656 |
| Jun-07 | 109.7687418 | 119.7635 |
| Jul-07 | 109.3457775 | 121.3385 |
| Aug-07 | 110.9221321 | 123.7089 |
| Sep-07 | 110.0644907 | 120.8177 |
| Oct-07 | 110.5507563 | 126.7451 |
| Nov-07 | 110.8587666 | 128.7772 |
| Dec-07 | 109.6679301 | 128.0887 |
| Jan-08 | 113.1507564 | 134.2283 |
| Feb-08 | 112.9452324 | 132.2145 |
| Mar-08 | 109.589597 | 127.0248 |
| Apr-08 | 113.3420124 | 133.1283 |
| May-08 | 109.9154475 | 133.2609 |
| Jun-08 | 109.9546487 | 129.618 |
| Jul-08 | 110.4258564 | 134.0199 |
| Aug-08 | 108.9974404 | 132.785 |
| Sep-08 | 108.5302633 | 133.1188 |
| Oct-08 | 108.1386374 | 132.8963 |
| Nov-08 | 101.9502422 | 120.8312 |
| Dec-08 | 97.30491271 | 114.4648 |
| Jan-09 | 91.87684889 | 108.7525 |
| Feb-09 | 90.0751252 | 111.0955 |
| Mar-09 | 90.87635883 | 109.726 |
| Apr-09 | 90.04121374 | 112.5106 |
| May-09 | 88.3069123 | 110.5612 |
| Jun-09 | 89.19617668 | 115.8926 |
| Jul-09 | 92.44836161 | 118.4829 |
| Aug-09 | 91.67542616 | 118.0619 |
| Sep-09 | 95.20422014 | 124.1286 |
| Oct-09 | 96.2028439 | 126.8145 |
| Nov-09 | 96.95313029 | 128.2157 |
| Dec-09 | 97.96579194 | 134.5087 |
| Jan-10 | 96.79357865 | 132.1376 |
| Feb-10 | 97.93385945 | 132.9399 |
| Mar-10 | 101.7426644 | 135.8947 |
| Apr-10 | 101.2500146 | 136.0568 |
| May-10 | 102.5363447 | 137.5012 |
| Jun-10 | 105.5747986 | 140.2461 |
| Jul-10 | 104.2207436 | 139.0447 |
| Aug-10 | 104.972226 | 141.0486 |
| Sep-10 | 105.0463792 | 141.6175 |
| Oct-10 | 106.2356532 | 143.6146 |
| Nov-10 | 106.9610359 | 147.7732 |
| Dec-10 | 106.8082131 | 148.2411 |
| Jan-11 | 107.362386 | 148.93 |
| Feb-11 | 106.769118 | 147.9876 |
| Mar-11 | 107.0279424 | 151.4063 |
| Apr-11 | 106.0077808 | 148.2293 |
| May-11 | 108.2609332 | 150.5199 |
| Jun-11 | 105.3715554 | 151.928 |
| Jul-11 | 107.4482323 | 151.0695 |
| Aug-11 | 108.4734925 | 157.7119 |
| Sep-11 | 108.5105155 | 153.7029 |
| Oct-11 | 108.3102939 | 153.4857 |
| Nov-11 | 108.014069 | 155.4061 |
| Dec-11 | 108.8633023 | 154.2683 |
| Jan-12 | 107.9013595 | 155.4726 |
| Feb-12 | 108.3953786 | 157.539 |
| Mar-12 | 108.6655586 | 155.7044 |
| Apr-12 | 107.3715817 | 153.5011 |
| May-12 | 108.7158741 | 161.1103 |
| Jun-12 | 108.3351351 | 159.0962 |
| Jul-12 | 108.4705771 | 156.7044 |
| Aug-12 | 108.995262 | 156.9339 |
| Sep-12 | 107.7326238 | 160.2921 |
| Oct-12 | 106.8374972 | 161.6656 |
| Nov-12 | 107.0546841 | 162.327 |
| Dec-12 | 106.2229682 | 160.3606 |
| Jan-13 | 107.9322334 | 164.9596 |
| Feb-13 | 106.0724871 | 164.2713 |
| Mar-13 | 107.9330077 | 164.7152 |
| Apr-13 | 107.3970614 | 167.0876 |
| May-13 | 109.0633999 | 163.5265 |
| Jun-13 | 108.4589141 | 161.4848 |
| Jul-13 | 108.838107 | 165.3115 |
| Aug-13 | 109.2817186 | 166.6215 |
| Sep-13 | 108.874792 | 166.0463 |
| Oct-13 | 109.7550983 | 169.5589 |
| Nov-13 | 110.1911556 | 169.4903 |
| Dec-13 | 109.5349649 | 168.6437 |
| Jan-14 | 110.4393557 | 171.351 |
| Feb-14 | 108.9399472 | 170.4182 |
| Mar-14 | 109.5021678 | 169.2176 |
| Apr-14 | 110.2200331 | 171.6566 |
| May-14 | 111.2992868 | 169.6025 |
| Jun-14 | 109.760541 | 169.939 |
| Jul-14 | 111.5455718 | 172.6 |
| Aug-14 | 110.9015504 | 173.2122 |
| Sep-14 | 112.4701348 | 177.1195 |
| Oct-14 | 113.2224667 | 176.1961 |
| Nov-14 | 112.7076563 | 174.7696 |
| Dec-14 | 114.7150674 | 177.7008 |
| Jan-15 | 113.9198074 | 173.9636 |
| Feb-15 | 113.7221173 | 173.6601 |
| Mar-15 | 115.16902 | 168.1476 |
| Apr-15 | 113.8311797 | 168.5652 |
| May-15 | 112.2257488 | 165.4664 |
| Jun-15 | 114.117528 | 174.8322 |
| Jul-15 | 114.376627 | 172.8606 |
| Aug-15 | 114.3135615 | 170.9555 |
| Sep-15 | 115.6646929 | 170.5683 |
Source: CPB Trade Monitor and Treasury.
For China, Australia's largest trading partner, forecasts are unchanged since Budget, with growth moderating as the economy transitions. The traditional drivers of growth, including investment, industrial production and exports, remain weak reflecting overcapacity in some sectors as well as a difficult global environment. In contrast, retail sales growth remains stable and the labour market is relatively robust.
The Chinese authorities have reaffirmed their commitment to double GDP as well as income per capita from 2010 levels by 2020. They will be attempting to achieve this target as the economy transitions.
| Actuals | Forecasts | ||||
|---|---|---|---|---|---|
| 2014 | 2015 | 2016 | 2017 | ||
| China | 7.3 | 6 3/4 | 6 1/2 | 6 1/4 | |
| India | 7.1 | 7 1/4 | 7 1/2 | 7 1/2 | |
| Japan | 0.0 | 3/4 | 3/4 | 1/2 | |
| United States | 2.4 | 2 1/2 | 2 3/4 | 2 3/4 | |
| Euro area | 0.9 | 1 1/2 | 1 3/4 | 1 3/4 | |
| Other East Asia(a) | 4.1 | 3 3/4 | 4 1/4 | 4 1/4 | |
| Major trading partners | 4.2 | 4 | 4 | 4 | |
| World | 3.4 | 3 | 3 1/2 | 3 3/4 | |
(a) Other East Asia comprises the newly industrialised economies of Hong Kong, South Korea, Singapore and Taiwan and the Association of Southeast Asian Nations group of five (ASEAN‑5), comprising Indonesia, Malaysia, the Philippines, Thailand and Vietnam.
Note: World, euro area and other East Asia growth rates are calculated using GDP weights based on purchasing power parity (PPP), while growth rates for major trading partners are calculated using export trade weights.
Source: National Statistical Agencies, IMF World Economic Outlook October 2015, Thomson Reuters and Treasury.
Growth in the ASEAN 5 economies has slowed in 2015. The impact of China's transition is being felt in many of these economies, which are exposed to the slowing in Chinese investment and the slowing rate of growth in Chinese industrial production.
In Japan, growth is expected to pick up in 2015 and 2016 albeit at a slow pace. Japan continues to face significant structural challenges which present downside risks to growth.
Growth in the United States is forecast to be the strongest amongst the major advanced economies, but slower than expected at Budget. The labour market recovery continues. The domestically‑oriented sectors remain strong, outweighing the pressure on externally‑exposed sectors from a strong exchange rate and slower global growth. Growth is forecast to be 2½ per cent in 2015 and 2¾ per cent in 2016 and 2017.
The recovery in the euro area is expected to remain relatively subdued and expectations for growth in 2015 have been revised down marginally since Budget. During 2015 growth improved in Spain, Italy and Ireland while growth is lower than expected in Germany. Accommodative monetary policy, a weaker currency and lower commodity prices continue to support euro area activity. Immediate risks associated with Greece have abated, but structural challenges remain.
India continues to benefit from low commodity prices and is expected to remain the fastest growing major economy in 2015. Growth is expected to continue to be underpinned in coming years by the Indian Government's reform agenda, including the proposed reduction of company tax as well as measures to make doing business easier and more predictable.