
Statement 3: Fiscal Strategy and Outlook (continued)
Fiscal strategy
The Government's fiscal strategy, consistent with the requirements of the Charter of Budget Honesty Act 1998, is outlined in Box 1.
Box 1: The Government's fiscal strategy
Medium‑term fiscal strategy
The Government's medium‑term fiscal strategy is to achieve budget surpluses, on average, over the course of the economic cycle. The fiscal strategy underlines the commitment to budget discipline and outlines how the Government will set medium‑term fiscal policy while allowing for flexibility in response to changing economic conditions.
The strategy is underpinned by the following four policy elements:
- investing in a stronger economy by redirecting Government spending to quality investment to boost productivity and workforce participation;
- maintaining strong fiscal discipline by controlling expenditure to reduce the Government's share of the economy over time in order to free up resources for private investment to drive jobs and economic growth, with:
- the payments‑to‑GDP ratio falling;
- stabilising and then reducing net debt over time;
- supporting revenue growth by supporting policies that drive earnings and economic growth; and
- strengthening the Government's balance sheet by improving net financial worth over time.
Budget repair strategy
The Budget repair strategy is designed to deliver sustainable budget surpluses building to at least 1 per cent of GDP as soon as possible, consistent with the medium‑term fiscal strategy.
The strategy sets out that:
- new spending measures will be more than offset by reductions in spending elsewhere within the budget;
- the overall impact of shifts in receipts and payments due to changes in the economy will be banked as an improvement to the budget bottom line, if this impact is positive; and
- a clear path back to surplus is underpinned by decisions that build over time.
The Budget repair strategy will stay in place until a strong and sustainable surplus is achieved and so long as economic growth prospects are sound and unemployment remains low.
The Government's fiscal strategy aims to guide the budget back to a sustainable surplus at a responsible pace, with a particular focus on bringing spending down as a proportion of GDP and redirecting spending towards investment to promote jobs, growth and opportunity.
The Government is working to achieve a budget surplus at a sustainable level of Government expenditure, rather than through an unsustainable increase in the tax burden on the Australian economy that would threaten jobs, growth and Australia's successful economic transition.
Redirecting Government spending towards jobs and growth
This year's Budget focuses on implementing the Government's economic plan for jobs and growth. As Australia transitions to broader‑based growth the economy requires careful and considered economic management including continued fiscal restraint.
The Government's ten year enterprise tax plan will increase national and household incomes by providing incentives for businesses to invest, innovate and employ while also ensuring businesses pay the right amount of tax in Australia. Overall, the ten year enterprise tax plan is expected to deliver a permanent increase of GDP of just over one per cent in the long term. The ten year enterprise tax plan will support growth, higher wages and jobs by lowering the company tax rate over time to an internationally competitive level, with early cuts for smaller businesses. In addition, the Government will take a responsible first step towards personal income tax cuts by extending the 32.5 per cent tax threshold from $80,000 to $87,000.
The Government's changes to superannuation will improve the sustainability, flexibility and integrity of the superannuation system. The changes are anchored by the objective for superannuation, to provide income in retirement to substitute or supplement the Age Pension. They represent the second phase of the Government's reform to retirement incomes, building on fairer pension reforms in the 2015‑16 Budget. The changes better target superannuation concessions by introducing or lowering transfer balance and contribution caps, while providing savings support to those who need it most. The Government is enabling greater flexibility and choice in how people save for their retirement by allowing catch-up contributions, allowing all individuals under the age of 75 to claim a tax deduction for personal contributions and extending eligibility for individuals to claim a tax offset for contributions made to their spouse's superannuation.
The Government is supporting labour force participation by all Australians, especially helping young Australians move into employment. The $840.3 million innovative Youth Employment Package will help young people become more competitive in the labour market by giving them the employability skills that employers want, opportunities for work experience and the support to move from welfare to work.
The Government is investing a record $50 billion in infrastructure from 2013‑14 to 2019‑20. There are currently around 100 major projects under construction and 80 in the pre‑construction stage involving detailed design and planning works, procurement, geotechnical assessments, environmental assessments and land clearing.
The Government remains committed to keeping Australia and Australians safe and secure. Through the 2016 Defence White Paper, the Government is providing an additional $29.9 billion in defence investments to boost Australia's defence capabilities over the period to 2025‑26. Investing in defence capabilities will secure an advanced local defence manufacturing industry driving high tech jobs for decades.
The Government is providing record and affordable levels of financial assistance to support hospitals and schools, with funding linked to reforms which focus on improving quality and patient safety in hospitals and improved student outcomes in schools. These three‑year funding arrangements provide an opportunity to develop longer‑term funding arrangements and further reforms that focus on quality and sustainability into the future.
Together these packages deliver on the Government's fiscal strategy of redirecting spending to quality investment that will boost productivity and workforce participation.
Budget surpluses over the course of the economic cycle
The Government remains committed to returning the Budget to surplus as soon as possible. Sustained discipline and determination is needed to consolidate the Budget by bringing expenditure under control and boosting revenues by implementing policies that drive prosperity, investment, jobs and growth. This is why, at this Budget, the overall impact of policy decisions is an improvement of $1.7 billion over the four years from 2016‑17 to 2019‑20 in the underlying cash balance.
This Budget maintains a steady trajectory towards surplus. The deficit is expected to fall from $37.1 billion in 2016‑17 (2.2 per cent of GDP) to $6.0 billion in 2019‑20 (0.3 per cent of GDP), as shown in Table 2.
| Actual | Estimates | Projections | ||||||||
|---|---|---|---|---|---|---|---|---|---|---|
| 2014‑15 | 2015‑16 | 2016‑17 | 2017‑18 | 2018-19 | 2019-20 | Total(a) | ||||
| $b | $b | $b | $b | $b | $b | $b | ||||
| Receipts | 378.3 | 388.0 | 411.3 | 437.4 | 469.9 | 500.7 | 1,819.3 | |||
| Per cent of GDP | 23.5 | 23.5 | 23.9 | 24.2 | 24.8 | 25.1 | ||||
| Payments(b) | 412.1 | 425.0 | 445.0 | 459.9 | 481.5 | 502.6 | 1,889.0 | |||
| Per cent of GDP | 25.6 | 25.8 | 25.8 | 25.5 | 25.4 | 25.2 | ||||
| Net Future Fund earnings | 4.1 | 3.0 | 3.3 | 3.6 | 3.8 | 4.1 | 14.9 | |||
| Underlying cash balance(c) | -37.9 | -39.9 | -37.1 | -26.1 | -15.4 | -6.0 | -84.6 | |||
| Per cent of GDP | -2.4 | -2.4 | -2.2 | -1.4 | -0.8 | -0.3 | ||||
| Revenue | 380.7 | 396.4 | 416.9 | 449.5 | 484.4 | 515.1 | 1,865.8 | |||
| Per cent of GDP | 23.7 | 24.0 | 24.2 | 24.9 | 25.5 | 25.9 | ||||
| Expenses | 417.9 | 431.5 | 450.6 | 464.8 | 489.3 | 511.6 | 1,916.3 | |||
| Per cent of GDP | 26.0 | 26.1 | 26.2 | 25.7 | 25.8 | 25.7 | ||||
| Net operating balance | -37.2 | -35.1 | -33.7 | -15.3 | -5.0 | 3.5 | -50.5 | |||
| Net capital investment | 2.7 | 4.4 | 3.4 | 3.4 | 4.9 | 5.5 | 17.2 | |||
| Fiscal balance | -39.9 | -39.4 | -37.1 | -18.7 | -9.8 | -2.1 | -67.7 | |||
| Per cent of GDP | -2.5 | -2.4 | -2.2 | -1.0 | -0.5 | -0.1 | ||||
| Memorandum item: | ||||||||||
| Headline cash balance | -38.9 | -51.5 | -53.4 | -34.2 | -23.9 | -14.4 | -126.0 | |||
(a) Total is equal to the sum of amounts from 2016‑17 to 2019‑20.
(b) Equivalent to cash payments for operating activities, purchases of non‑financial assets and net acquisition of assets under finance leases.
(c) Excludes net Future Fund earnings.
Government receipts, although growing, continue to be impacted by weaker nominal GDP, weighed down by weaker wages and inflation. Expected tax receipts, excluding new policy, have lessened by around $4.6 billion in 2016‑17 and $13.5 billion over the four years to 2018‑19 since the 2015‑16 MYEFO. As a result, compared with the 2015‑16 MYEFO, the underlying cash balance has deteriorated by $3.4 billion in 2016‑17.
Weaker‑than‑forecast total wages contribute to lower forecasts for taxes from individuals of $12 billion over the four years to 2018‑19, excluding new policy. In addition, forecast superannuation fund tax, excluding new policy has been revised down by $5.5 billion. These downward revisions have been partly offset by upwards revisions to forecast indirect taxes. Lower‑than‑expected taxation receipts remains a major challenge for delivering fiscal consolidation and underlines the importance of continued spending restraint.
The underlying cash balance is projected to continue to improve over the medium term, reaching a surplus of around 0.2 per cent of GDP by 2020‑21, before peaking at around 0.3 per cent of GDP the following year. It is projected to fall gradually over the rest of the medium term.
The Government has a target of reaching a surplus of 1 per cent of GDP as soon as possible, consistent with the objective of running surpluses on average over the course of the economic cycle.
The medium‑term projections do not yet meet this target, indicating that although progress has already been made on the Budget repair task, there is much more work required in the future, noting that projections over the next ten years are subject to considerable uncertainty.
Medium‑term projections outline the broad trajectory of the fiscal position under current policy settings. Small changes to underlying assumptions around the economy or future policy can have large impacts on projections of fiscal aggregates (see Box 3).
Chart 1 shows the projection of the underlying cash balance to 2026‑27.
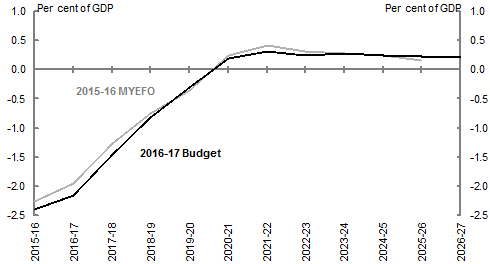
Note: A tax‑to‑GDP cap of 23.9 per cent is applied to these projections from 2021‑22. Net Future Fund earnings are included in projections of the underlying cash balance from 2020‑21 when drawdowns from the Future Fund commence.
Source: Treasury projections.
| X Values | 2015-16 MYEFO | 2016-17 Budget |
|---|---|---|
| 2015-16 | -2.3 | -2.4 |
| 2016-17 | -1.9 | -2.2 |
| 2017-18 | -1.3 | -1.4 |
| 2018-19 | -0.7 | -0.8 |
| 2019-20 | -0.4 | -0.3 |
| 2020-21 | 0.2 | 0.2 |
| 2021-22 | 0.4 | 0.3 |
| 2022-23 | 0.3 | 0.2 |
| 2023-24 | 0.3 | 0.3 |
| 2024-25 | 0.2 | 0.2 |
| 2025-26 | 0.2 | 0.2 |
| 2026-27 | 0.2 |
Compared with the 2015‑16 MYEFO, the revised medium‑term projections reflect a number of broadly offsetting factors. Spending on schools, hospitals and defence is projected to be higher over the medium term. This is offset by lower projected public debt interest, as higher borrowing is more than offset by a decline in bond yields. There has also been a significant reduction in payments due to parameter revisions over the forward estimates and this effect carries through over the medium term. After 2021‑22, receipts are projected to grow broadly in line with payments.
Structural budget balance estimates
Restoring the structural integrity of the budget is crucial for achieving surpluses on average over the economic cycle and paying down government debt, consistent with the medium term fiscal strategy.
The structural budget balance estimates remove factors that have a temporary impact on revenues and expenditures, such as fluctuations in commodity prices and the extent to which economic output deviates from its potential level. Considered in conjunction with other measures, estimates of the structural budget balance can provide insight into the sustainability of current fiscal settings.
Treasury estimates of the terms of trade outlook over the medium term have been revised downward compared with the 2015‑16 MYEFO. This has contributed to downward revisions to estimated structural revenues. In net terms the estimates of the structural budget balance have, on average, deteriorated by less than a quarter of a per cent of annual GDP in each year over the next decade.
Despite the downward revisions since MYEFO, the overall level of the structural budget balance improves from a deficit of around 2 per cent of GDP in 2015‑16, to a series of small surpluses from 2020‑21 onwards, converging to the underlying cash balance (Chart 2).
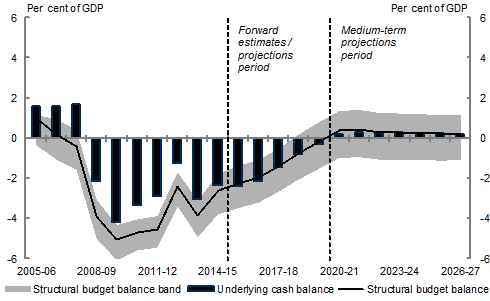
Note: The methodology for producing structural budget balance estimates was detailed in Treasury Working Paper 2013‑01 and incorporates the medium term projection methodology detailed in Treasury Working Paper 2014‑02.
Source: ABS cat. no. 5206.0, 5302.0, 6202.0, 6401.0 and Treasury.
| Date | Underlying cash balance | Structural budget balance | Upper bound | Lower bound |
|---|---|---|---|---|
| 2005-06 | 1.6 | 1.0 | 1.2 | -0.3 |
| 2006-07 | 1.6 | 0.2 | 1.0 | -1.0 |
| 2007-08 | 1.7 | -0.4 | 0.4 | -1.6 |
| 2008-09 | -2.1 | -3.9 | -3.1 | -5.0 |
| 2009-10 | -4.2 | -5.0 | -4.3 | -6.1 |
| 2010-11 | -3.4 | -4.7 | -4.0 | -5.6 |
| 2011-12 | -2.9 | -4.5 | -3.9 | -5.4 |
| 2012-13 | -1.2 | -2.4 | -1.7 | -3.4 |
| 2013-14 | -3.1 | -3.9 | -3.1 | -4.9 |
| 2014-15 | -2.4 | -2.6 | -1.8 | -3.8 |
| 2015-16 | -2.4 | -2.2 | -1.4 | -3.5 |
| 2016-17 | -2.2 | -2.0 | -1.1 | -3.2 |
| 2017-18 | -1.4 | -1.4 | -0.5 | -2.7 |
| 2018-19 | -0.8 | -0.7 | 0.2 | -2.0 |
| 2019-20 | -0.3 | -0.2 | 0.8 | -1.5 |
| 2020-21 | 0.2 | 0.4 | 1.4 | -1.0 |
| 2021-22 | 0.3 | 0.4 | 1.4 | -0.9 |
| 2022-23 | 0.2 | 0.3 | 1.3 | -1.1 |
| 2023-24 | 0.3 | 0.3 | 1.2 | -1.1 |
| 2024-25 | 0.2 | 0.2 | 1.2 | -1.1 |
| 2025-26 | 0.2 | 0.2 | 1.2 | -1.1 |
| 2026-27 | 0.2 | 0.2 | 1.1 | -1.1 |
Maintaining strong fiscal discipline
Continued strong fiscal discipline will reduce the Government's share of the economy over time in order to free up resources for private investment to drive jobs and economic growth.
The Government's fiscal strategy aims to have the payments‑to‑GDP ratio and net debt reducing over time.
Government payments as a share of GDP are forecast to decline from 25.8 per cent of GDP in 2016‑17 to 25.2 per cent of GDP in 2019‑20 but are projected to rise slightly and remain stable over the medium term. Due to demographic and other pressures, payments are projected to increase gradually as a share of GDP to around 25.4 per cent in 2026‑27.
Since the 2015‑16 MYEFO, the payments‑to‑GDP ratio has been affected by weaker nominal GDP levels over the forecast period. However, annual nominal payment levels remain consistent with those published at the 2015‑16 MYEFO.
Real payments growth from 2015‑16 until 2019‑20 is expected to be 1.9 per cent per annum on average, broadly consistent with the 2015‑16 MYEFO.
Over the period from 2020‑21 to 2026‑27, average real growth in payments is projected to be around 2.9 per cent per annum, around one percentage point higher than estimated average real growth in payments over the forward estimates.
The medium‑term projections reflect the assumption that current policy settings do not change over the medium‑term. A continued focus on ongoing expenditure restraint will be required if the Government is to deliver on its medium term fiscal strategy and Budget repair strategy.
Box 2: National Disability Insurance Scheme
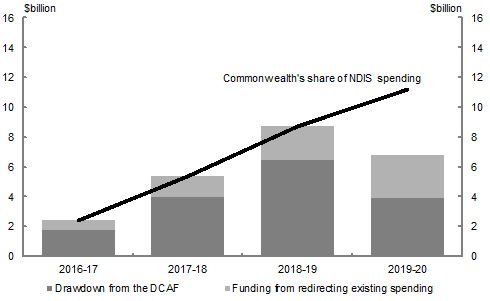
Spending on the National Disability Insurance Scheme (NDIS) increases substantially over the next four years as the scheme expands to full coverage in 2019‑20 (see chart 3). When the NDIS reaches full scheme in 2019‑20, it is estimated that it will cost $21.6 billion, or around 1.1 per cent of GDP. The Commonwealth's contribution will be around $11.2 billion. The Government is committed to fully funding this vital scheme.
The costs of the NDIS are offset to 2018‑19 through redirecting existing disability funding and accumulated funds from the 0.5 percentage point increase in the Medicare Levy invested in the DisabilityCare Australia Fund (DCAF).
By 2019‑20 the accumulated DCAF funds will be fully drawn down, so only the $3.9 billion of the Commonwealth's share of the Medicare Levy will be available from the DCAF. This combined with the increase of $2.4 billion in NDIS spending in this year mean that there will be a $4.4 billion shortfall to be funded from general budget revenue or borrowings. This shortfall continues in each year beyond 2019‑20.
| $ billion | 2016-17 | 2017-18 | 2018-19 | 2019-20 |
|---|---|---|---|---|
| Commonwealth's share of NDIS spending | 2.4 | 5.4 | 8.8 | 11.2 |
| Funding from directing existing spending | 0.6 | 1.4 | 2.2 | 2.9 |
| Drawdown from the DCAF | 1.8 | 4 | 6.5 | 3.9 |
The Government is establishing the NDIS Savings Fund to help the Commonwealth to meet these future costs of the NDIS. This fund will hold NDIS underspends, and selected saves from across the Government, and will be drawn down to fund the NDIS from 2019‑20.
In addition to the $162.4 million already set aside in the Savings Fund in the 2015‑16 MYEFO, as announced on 16 March 2016, in this Budget the Government will credit an additional $2.1 billion to the fund. This includes $711.2 million over five years from reduced net costs in NDIS transition agreements, and $1.3 billion of savings achieved over five years through more efficiently targeting social welfare expenditure. Additional savings will be added in the coming years.
Strengthening the Government's balance sheet over time
A strong balance sheet provides the Government the flexibility to respond to unanticipated events during times of financial crises or economic shocks.
Key aggregates of fiscal sustainability are set out in Table 3.
Net financial worth is the broadest indicator of fiscal sustainability articulated in the medium term fiscal strategy. It provides a summary measure of the Government's assets and liabilities as it includes both the full assets of the Future Fund and the superannuation liability that the Future Fund is intended to offset.
| Estimates | Projections | |||||
|---|---|---|---|---|---|---|
| 2015‑16 | 2016‑17 | 2017‑18 | 2018-19 | 2019-20 | ||
| $b | $b | $b | $b | $b | ||
| Financial assets | 342.6 | 383.4 | 414.0 | 432.2 | 453.4 | |
| Non-financial assets | 122.9 | 126.2 | 130.6 | 134.9 | 139.7 | |
| Total assets | 465.4 | 509.6 | 544.6 | 567.2 | 593.1 | |
| Total liabilities | 730.4 | 810.6 | 859.2 | 886.6 | 909.2 | |
| Net worth | -265.0 | -300.9 | -314.6 | -319.4 | -316.1 | |
| Net financial worth(a) | -387.9 | -427.2 | -445.2 | -454.3 | -455.8 | |
| Per cent of GDP | -23.5 | -24.8 | -24.6 | -24.0 | -22.9 | |
| Net debt(b) | 285.7 | 326.0 | 346.8 | 356.4 | 355.1 | |
| Per cent of GDP | 17.3 | 18.9 | 19.2 | 18.8 | 17.8 | |
| Net interest payments | 12.0 | 12.6 | 13.4 | 14.2 | 14.2 | |
| Per cent of GDP | 0.7 | 0.7 | 0.7 | 0.8 | 0.7 | |
(a) Net financial worth equals total financial assets minus total liabilities.
(b) Net debt equals the sum of deposits held, government securities, loans and other borrowing, minus the sum of cash and deposits, advances paid and investments, loans and placements.
Net debt incorporates both selected financial assets and liabilities mostly at their fair value and provides a broader measure of the financial position of the Commonwealth than gross debt.
Net debt is estimated to be 18.9 per cent of GDP in 2016‑17 and to peak as a share of GDP at 19.2 per cent in 2017‑18, slightly above the peak of 18.5 per cent of GDP expected at the 2015‑16 MYEFO. Net debt then declines as a share of GDP to 17.8 per cent by 2019‑20.
Net debt is projected to continue to improve over the medium term, falling to around 9.1 per cent of GDP by 2026‑27 (Chart 4). In 2025‑26, net debt is projected to be around 9.7 per cent of GDP, this is around 0.1 per cent of GDP higher than projected at the 2015‑16 MYEFO.
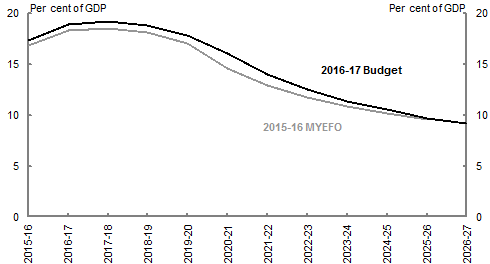
Note: A tax‑to‑GDP cap of 23.9 per cent is applied to these projections from 2021‑22.
Source: Treasury projections.
| X Values | MYEFO 2015-16 | Budget 2016-17 |
|---|---|---|
| 2015-16 | 16.9 | 17.3 |
| 2016-17 | 18.3 | 18.9 |
| 2017-18 | 18.5 | 19.2 |
| 2018-19 | 18.2 | 18.8 |
| 2019-20 | 17.0 | 17.8 |
| 2020-21 | 14.5 | 16.1 |
| 2021-22 | 12.9 | 14.0 |
| 2022-23 | 11.8 | 12.5 |
| 2023-24 | 10.9 | 11.4 |
| 2024-25 | 10.2 | 10.5 |
| 2025-26 | 9.6 | 9.7 |
| 2026-27 | 9.1 |
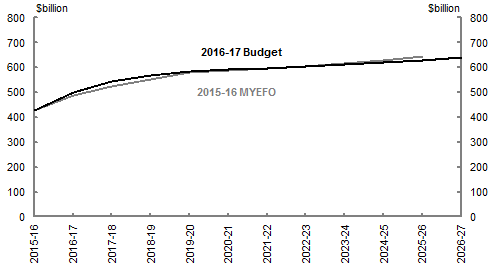
The face value of CGS on issue (gross debt) is projected to rise from $499 billion in 2016‑17 to $584 billion by the end of the forward estimates. Gross debt is projected to continue to rise to around $640 billion by 2026‑27. At the 2015‑16 MYEFO, gross debt was projected to be $647 billion in 2025‑26. The reduction in CGS on issue at the end of the medium term is driven by lower assumed yields across the medium term.
The current projections indicate the maximum face value of CGS on issue, subject to the Treasurer's Direction, of $500 billion will be approached in the latter part of 2016‑17. A new Treasurer's Direction would need to be issued before this time.
Further details on debt and the Government's balance sheet can be found in Statement 6: Debt Statement, Assets and Liabilities.
The projected face value of Commonwealth Government Securities on issue is shown in Chart 5.
Note: A tax‑to‑GDP cap of 23.9 per cent is applied to these projections from 2021‑22.
Source: Australian Office of Financial Management and Treasury projections.
| X Values | 2015-16 MYEFO ($bn) | 2016-17 Budget ($bn) |
|---|---|---|
| 2015-16 | 428.8 | 427 |
| 2016-17 | 488.7 | 499.2 |
| 2017-18 | 525.6 | 544.8 |
| 2018-19 | 551.8 | 567.6 |
| 2019-20 | 580 | 583.6 |
| 2020-21 | 588.4 | 592 |
| 2021-22 | 594.9 | 596.3 |
| 2022-23 | 605.2 | 606 |
| 2023-24 | 616 | 611.6 |
| 2024-25 | 629 | 619.4 |
| 2025-26 | 646.5 | 629.3 |
| 2026-27 | - | 640.2 |
Net worth is expected to be ‑$300.9 billion in 2016‑17, $18.0 billion lower than estimated at the 2015‑16 MYEFO. Net worth is expected to be ‑$316.1 billion by the end of the forward estimates.
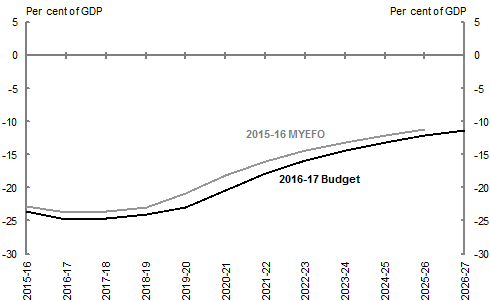
Net financial worth is estimated to be ‑$427.2 billion (‑24.8 per cent of GDP) in 2016‑17, $17.5 billion lower than estimated at the 2015‑16 MYEFO. Compared with the 2015‑16 MYEFO, net financial worth has deteriorated over the forward estimates. This reflects higher CGS issuance and a lower value of investments held by the Government, including the Future Fund. In part, this has been offset by an increase in deposits held by the Government from 2016‑17 onwards and a decrease in superannuation liabilities.
Net financial worth improves as a share of GDP over the medium term, rising to ‑$326 billion (‑11.3 per cent of GDP) by 2026‑27 (Chart 6).
Source: Treasury projections.
| x Values | 2015-16 MYEFO | 2016-17 Budget |
|---|---|---|
| 2015-16 | -22.9 | -23.5 |
| 2016-17 | -23.7 | -24.8 |
| 2017-18 | -23.5 | -24.6 |
| 2018-19 | -23.0 | -24.0 |
| 2019-20 | -20.8 | -22.9 |
| 2020-21 | -18.2 | -20.4 |
| 2021-22 | -16.0 | -17.8 |
| 2022-23 | -14.4 | -15.9 |
| 2023-24 | -13.2 | -14.4 |
| 2024-25 | -12.1 | -13.2 |
| 2025-26 | -11.2 | -12.1 |
| 2026-27 | -11.3 |
Box 3: Medium‑term projections
The 2016‑17 Budget projections indicate that the underlying cash balance will reach a surplus in 2020‑21, consistent with the projections in the 2015‑16 MYEFO. By 2026‑27, it is projected to be 0.2 per cent of GDP.
The medium‑term projections indicate that there is much more work to do to deliver surpluses building to at least 1 per cent of GDP, consistent with the Government's medium‑term fiscal strategy and Budget repair strategy. To achieve surpluses of this magnitude, it will be critical to constrain growth in Government payments over a sustained period. Payments as a proportion of GDP are forecast to fall to 25.2 per cent by the end of the forward estimates but rise and then stabilise over the medium term.
The medium‑term fiscal projections bring together projections of receipts, payments (including interest payments) and the Government's assets and liabilities for the seven years beyond the forward estimates period. They outline how the fiscal position may change over time under current policy settings and prevailing economic assumptions and are not equivalent to forecasts.
Medium‑term projections are a product of the assumptions that underpin them and are therefore subject to considerable uncertainty. Small changes in assumptions can have large impacts on the fiscal aggregates over the projection period. Two critical assumptions relate to the level of tax receipts and the rate of payments growth.
The medium‑term projections in the Budget assume that tax receipts do not increase above 23.9 per cent of GDP. This is an assumption adopted for technical purposes and does not represent a Government policy or target. This is based on the average tax‑to‑GDP ratio from the introduction of the GST and prior to the Global Financial Crisis. It reflects that a strict no‑policy change scenario would be unrealistic, as unconstrained revenue projections imply constantly increasing average tax rates on personal income. In the 2016‑17 Budget, tax receipts are projected to reach 23.9 per cent of GDP in 2021‑22.
In contrast, payments are assumed to grow in line with current policy settings over the medium term. Under current settings, this is real growth of around 2.9 per cent per year. All else remaining equal, future changes to policy that increase payments, particularly in key expenditure areas, would increase this projected growth rate.
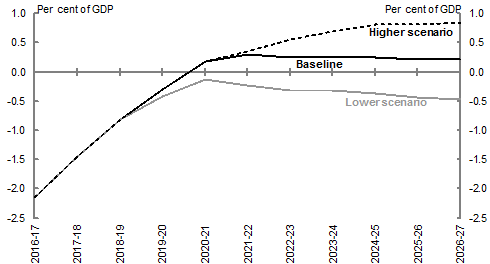
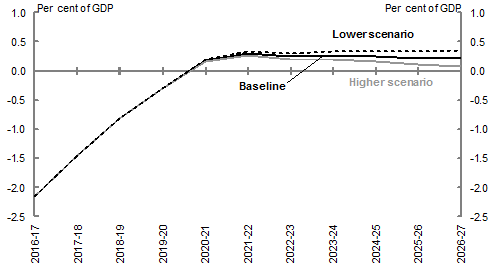
Charts 7 and 8 demonstrate the impact of changes to these assumptions.
The Budget projection is for a surplus of around 0.2 per cent of GDP in 2026‑27 with an assumed tax‑to‑GDP level of 23.9 per cent. An assumption of 23.4 per cent would mean a projected underlying cash deficit in 2026‑27 of 0.5 per cent of GDP (Chart 7). An assumption of 24.4 per cent would mean a projected surplus of 0.8 per cent of GDP in 2026‑27.
Note: A tax‑to‑GDP cap of 23.9 per cent of GDP is applied to the baseline projections from 2021‑22.
Source: Treasury projections.
| X Values | Baseline | Lower cap (23.4%) | Higher cap (24.4%) |
|---|---|---|---|
| 2016-17 | -2.2 | -2.2 | -2.2 |
| 2017-18 | -1.4 | -1.4 | -1.4 |
| 2018-19 | -0.8 | -0.8 | -0.8 |
| 2019-20 | -0.3 | -0.4 | -0.3 |
| 2020-21 | 0.2 | -0.1 | 0.2 |
| 2021-22 | 0.3 | -0.2 | 0.4 |
| 2022-23 | 0.2 | -0.3 | 0.6 |
| 2023-24 | 0.3 | -0.3 | 7.0 |
| 2024-25 | 0.2 | -0.4 | 0.8 |
| 2025-26 | 0.2 | -0.4 | 0.8 |
| 2026-27 | 0.2 | -0.5 | 0.8 |
Payments growth assumed to be 0.1 percentage points higher in each year of the medium term would mean a lower projected underlying cash result than in the Budget (Chart 8). An equivalent reduction in the assumed rate of payments growth would improve the underlying cash balance.
Note: A tax‑to‑GDP cap of 23.9 per cent of GDP is applied to the baseline projections from 2021‑22.
Source: Treasury projections.
| X-values | Baseline | Higher Payments Scenario | Lower Payments Scenario |
|---|---|---|---|
| 2016-17 | -2.2 | -2.2 | -2.2 |
| 2017-18 | -1.4 | -1.4 | -1.4 |
| 2018-19 | -0.8 | -0.8 | -0.8 |
| 2019-20 | -0.3 | -0.3 | -0.3 |
| 2020-21 | 0.2 | 0.2 | 0.2 |
| 2021-22 | 0.3 | 0.3 | 0.3 |
| 2022-23 | 0.2 | 0.2 | 0.3 |
| 2023-24 | 0.3 | 0.2 | 0.3 |
| 2024-25 | 0.2 | 0.2 | 0.3 |
| 2025-26 | 0.2 | 0.1 | 0.3 |
| 2026-27 | 0.2 | 0.1 | 0.4 |