
Tax Expenditures by Functional Categories
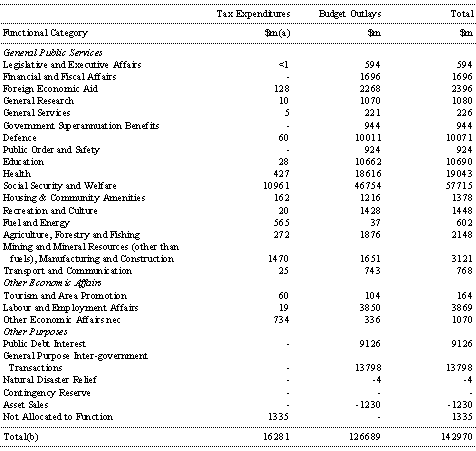
Table C2 compares
the costs of identified tax expenditures in 1995-96
with direct outlays by functional category. The functional
categories are the same as for outlays in this Statement.
The figures for a number of tax expenditure categories
are only approximations as some tax expenditures do
not lend themselves to easy categorisation. For example,
a general industry assistance measure will apply to
all industries and it will not be possible to determine
precisely which industry sectors have accessed the
tax concession. Tax expenditures that cannot be classified
as belonging to a particular functional category are
aggregated in the 'Not Allocated to Function' category.
Table C2 shows
that most tax expenditures are classified as being
related to Social Security and Welfare (this category
includes superannuation tax concessions).
- Around 19 per cent of total assistance in this category
is provided through tax expenditures.
The table also highlights the significant tax relief
provided to some business and industry categories through
tax expenditures.
- For example, under the Mining and Mineral Resources
(other than fuels), Manufacturing and Construction,
and Agriculture, Forestry and Fishing categories, 33
per cent of total assistance is provided through tax
expenditures.
Table
C2: Aggregate Tax Expenditures and Direct Outlays by
Functional Category 1995-96
< 1 Denotes less than $1 million.
- (a) Aggregate cost of tax expenditures in functional
categories is derived by summing the individual tax
expenditure costings.
(b) Items may not sum to totals due to rounding.


