CHART 1: SECTORAL SHARES OF OUTPUT - AUSTRALIA(a)
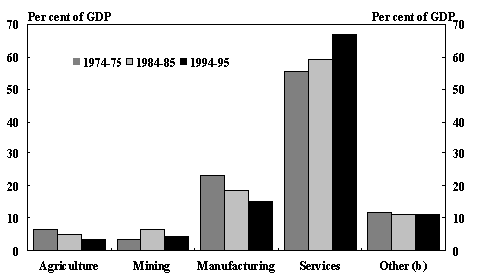
(b) 'Other' includes electricity, gas & water and construction.
Source: Reserve Bank of Australia, Australian Economic Statistics: 1949-50 to 1994-95, 1996 and Treasury estimates.
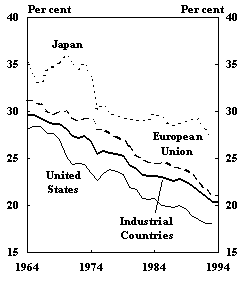
| CHART 2: SECTORAL SHARES OF VALUE ADDED - INDUSTRIAL COUNTRIES(a) | |
| MANUFACTURING | SERVICES |
|
|
Source: IMF, World Economic Outlook, April 1997.
Advances in transport and communications have been important catalysts for change. Lower costs of international transactions (Chart 3) have helped to enhance the efficiency of international markets, reduce consumer prices and increase international competition. Increased exposure to goods of foreign origin has helped to stimulate greater innovation in order to meet that international competition and has served as a conduit for faster diffusion of technological progress and organisational change.
Changes in information technology have spawned the creation of computer hardware and software industries. Increases in computing power have allowed information to be processed in greater quantities and with more speed, increasing demand for information services and underpinning advances in communication which have assisted the process of increased international integration. Enhanced information processing has also assisted in accelerating the spread of knowledge, potentially advancing the rate of technological progress in a wide range of areas. These influences accelerate changes in the types of goods and services purchased and how and where they are produced.
CHART 3: INTERNATIONAL TRANSPORT AND COMMUNICATION COSTS(a)
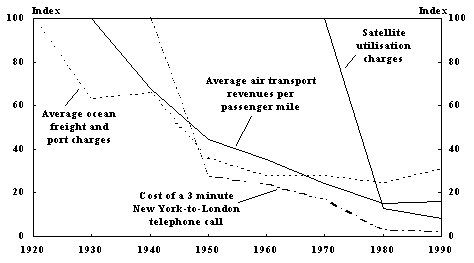
Source: World Bank, World Development Report, 1995.
Increased trade intensity is partly the result of technological advances in transport and communications. Also important are the reductions that have occurred in trade barriers around the world, flowing from a recognition of the inherent economic costs of such protection. Some of these reductions reflect GATT negotiations, but unilateral initiatives have also been important. More than 70 countries, including Australia, independently reduced their trade barriers between 1986 and 1993. [2]
Capital has also become increasingly mobile, with advances in computing and communications allowing capital markets to respond rapidly to developments throughout the world. Such technological developments have complemented financial deregulation and the easing of restrictions on foreign exchange transactions, often associated with more flexible exchange rate regimes.
CHART 4: EXPORTS PLUS IMPORTS AS A PROPORTION OF GDP(a)
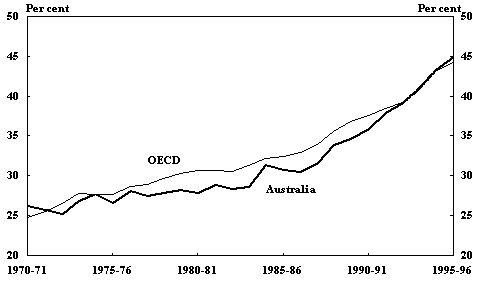
Source: ABS Cat. Nos. 5302.0, 5206.0 and OECD, National Accounts: Main Aggregates, Vol. 1, 1997.
World capital flows have risen significantly in recent decades. Australia's capital flows have also increased considerably, particularly since the early 1980s. The stock of foreign investment in Australia has risen from around 32 per cent of GDP in the early 1980s to around 90 per cent by the end of 1995-96 (the bulk of this investment is in the form of debt rather than foreign ownership). This sharp rise in foreign investment in Australia has reflected: a shift down in domestic saving relative to overall investment; the breadth of investment opportunities; the stability of our economic and political framework; financial deregulation here and abroad; and the proximity of overseas markets with potential for rapid growth. There has also been a sharp increase in the stock of Australian investment abroad, from around 11 per cent of GDP in the early 1980s to 31 per cent at the end of 1995-96. An important component of this has been direct investment, reflecting a desire of Australian firms to invest in productive capacity in export markets in which they have established a presence and to become insiders in foreign markets by locating some functions abroad.
Overall, developments overseas create significant pressures for structural change in the Australian economy. Opportunities for expansion in trade provide the basis for greater specialisation in areas of relative economic strength - a prescription for higher living standards through the opportunity to make the best use of available resources.
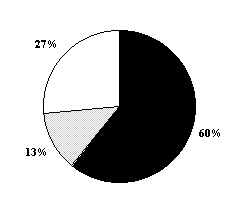
| CHART 5: DIRECTION OF AUSTRALIA'S EXPORTS | |
| 1975 | 1995 |
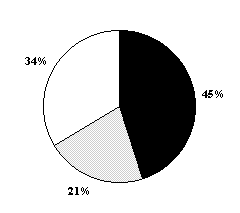
| 
|
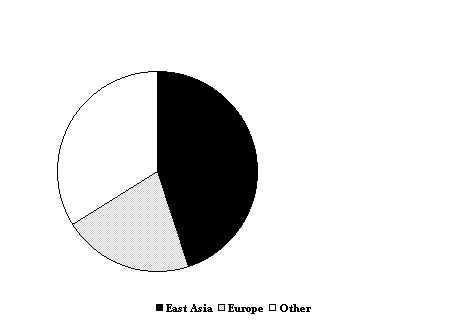
| |
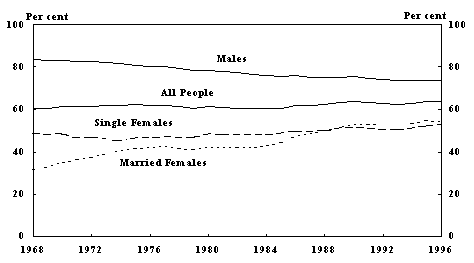
Demographic factors and changes in social preferences have resulted in changes in the composition of the work force, particularly in relation to participation and hours worked. Increasing participation by married women in the labour force has underpinned an increase in the past 30 years in the proportion of the population either employed or looking for work (Chart 6). Over the same period, average weekly hours worked have declined from around 39 hours in the second half of the 1960s to around 36 hours in the first half of the 1990s. Notwithstanding that aggregate decline, the proportion of males working more than 49 hours rose from 20 per cent in 1981 to 29 per cent in 1996, while the proportion of employed females working such hours rose from 6 per cent to 9 per cent [3].
CHART 6: LABOUR FORCE PARTICIPATION
Changes in the composition of the work force have been accompanied by declining trade union membership. Membership fell from 51 per cent of employees in 1976 to 31 per cent in 1996. [4]
Skilled workers who are able to take advantage of new technology and are more adaptable to new work arrangements are becoming more highly valued. In both the 1970s and the 1980s employment growth was weakest for the generally less skilled occupations - labourers and related workers - and strongest for the more skilled occupations - professionals and para-professionals. This trend has continued in the 1990s, with the highest incidence of unemployment occurring among those with the lowest levels of educational attainment (Chart 7).
CHART 7: UNEMPLOYMENT RATE BY EDUCATIONAL ATTAINMENT (MAY 1996)
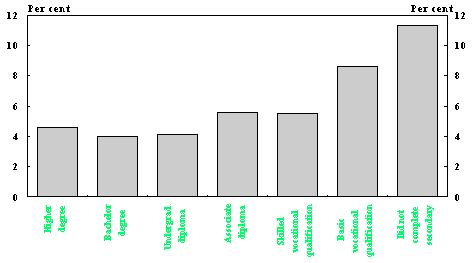
CHART 8: PROPORTION OF INDUSTRY EMPLOYEES WITH A DEGREE(a)
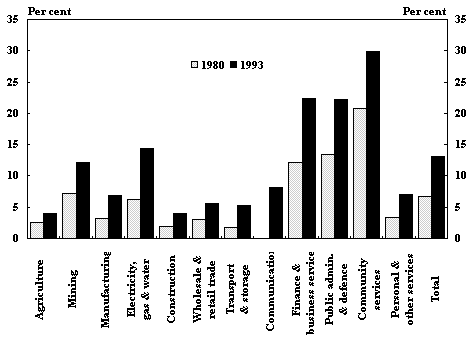
Source: ABS Cat. No. 6235.0.
Such changes in composition may reflect a response to changes in relative prices and incomes as well as changes in tastes. Changes in relative prices may occur because of, say, the development of new or cheaper products embodying new technology or because of reductions in protection or changes in rates of taxation applying to particular goods and services. Falling relative prices of particular items may result in a higher or lower proportion of income being spent on them, depending on the price and income elasticities of demand. In addition, increasing incomes influence consumption patterns as those on higher incomes tend to spend proportionately less of their incomes on food and more on recreation and entertainment. [6] Other demographic changes, such as increased female participation in the work force, may also result in changed spending patterns.
CHART 9: SHARES OF CONSUMPTION SPENDING AS A PROPORTION OF TOTAL CONSUMPTION(a)
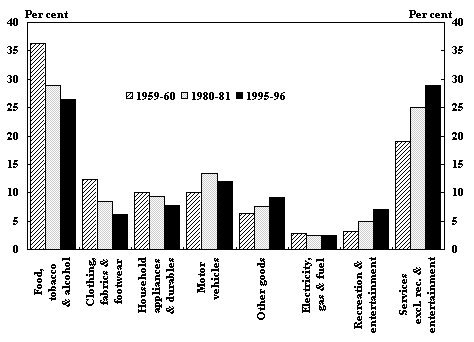
Source: ABS Cat. No. 5206.0.