
Consistent with the experience of a number of other industrial economies, the overall benefits from the reforms undertaken are becoming evident - particularly in the industries directly affected but also at the economy-wide level.
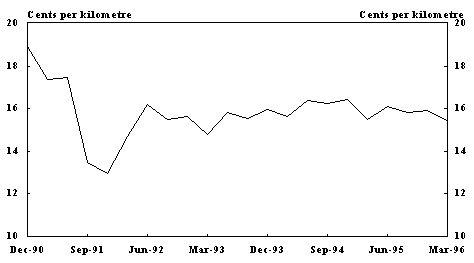
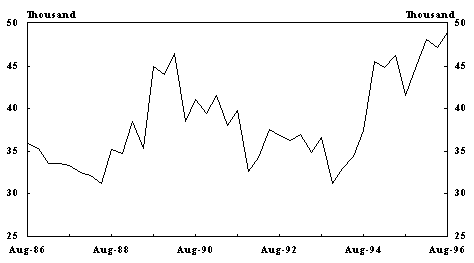
Domestic aviation provides a good example of the benefits of increased competition. Prices fell with the end of the 'two airline policy' in October 1990 (Chart 10) and, with lower prices, passenger numbers have increased by around 75 per cent. Employment in August 1996 was 19 per cent above the August 1990 level and also in excess of the temporary peak reached in the late 1980s (Chart 11).
CHART 10: AVERAGE AIRFARES (1989-90 DOLLARS)
In the communication services industry, measures to improve the commercial focus of Telstra and Australia Post include the introduction of managed competition in the telecommunications sector from 1992 and the reduction in 1994 in Australia Post's monopoly over some previously reserved postal services. A fall in Telstra's employment over the 1990s has been offset by increased employment elsewhere within the industry, including the new carriers (Optus and Vodafone) and the service providers that have emerged since the removal of Telstra's monopoly over many activities. Similarly, a reduction in employment in Australia Post over the 1990s has been offset by increased employment amongst private couriers and mail handlers. Overall employment in the communication industry (postal, courier and telecommunication services) has increased from around 150,000 at the end of 1989 to around 170,000 at the end of 1996. The improved efficiencies stemming from these reforms are illustrated by the marked reductions in the price of Telstra's services during the 1990s accompanied by significant rises in profitability (reflected in higher dividends and corporate tax payments) and by improved quality and responsiveness of service. Similarly, Australia Post's profitability has risen significantly since 1992 even though the price of standard stamps has remained unchanged, and therefore fallen in real terms, over this period.
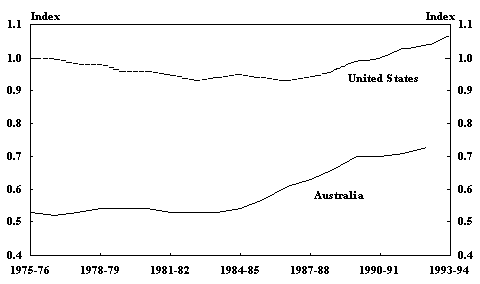
Corporatisation and privatisation of electricity businesses have also fostered a more commercial focus and helped to deliver substantial improvements in productivity in recent years, although productivity remains below international best practice (Chart 12). Some losses in employment in the industry itself have been partly offset by an increase in contracted labour supplying services to the electricity industry. Average prices have fallen by six per cent (in constant dollar terms) between 1989-90 and 1994-95.
CHART 12: TOTAL FACTOR PRODUCTIVITY LEVELS IN ELECTRICITY(a)
Source: Bureau of Industry Economics, Electricity 1996: International Benchmarking, September 1996.
Significant economy-wide benefits - in the form of increased output and employment - can flow from price reductions of significant inputs supplied to other business activities. Electricity is an area of considerable importance to downstream industries, and the Industry Commission (1996) calculated that implementation of a range of reforms in this industry could deliver an eventual gain in GDP of up to 1.3 per cent. The commencement of inter-State competition on the National Grid should help to realise those benefits and lift productivity performance towards international best practice. Benefits of increased competition in electricity have already been seen in Victoria where 78 per cent of firms surveyed by the Australian Chamber of Manufactures consider that they have been able to negotiate better prices as a result of recent reforms and only 10 per cent consider that they are worse off. [7]
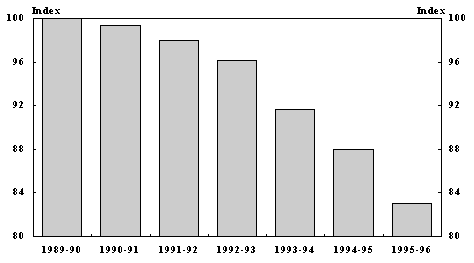
Overall, reforms to government business enterprises have resulted in lower costs for services provided, with surveyed prices for 58 major Commonwealth, State and Territory enterprises falling by around 10 per cent in the first half of the 1990s (Chart 13).
CHART 13: GOVERNMENT TRADING ENTERPRISES - AVERAGE REAL PRICES(a)
Source: Steering Committee on National Performance Monitoring of Government Trading Enterprises, Government Trading Enterprises Performance Indicators, various editions.
Potential benefits from wide-ranging microeconomic reform have been further emphasised in a number of studies (Chart 14). For example, the Industry Commission estimates that a range of reforms associated with the implementation of the National Competition Policy could boost GDP by around 5.5 per cent.
CHART 14: PROJECTED BENEFITS OF MICROECONOMIC REFORM(a)
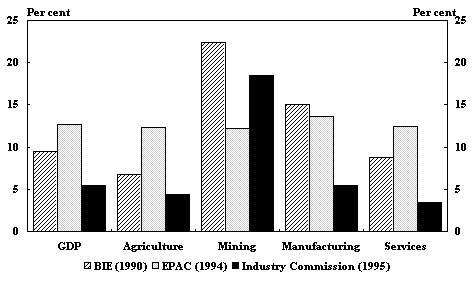
Source: Results reported in Bureau of Industry Economics, Setting the Scene: Micro Reform - Impact on Firms, 1996. The results are derived from different studies, each involving wide-ranging, but different, reforms: Bureau of Industry Economics, Microeconomic Reform and the Structure of Industry, 1990; Economic Planning and Advisory Council (authors R. Filmer and D. Dao), Economic Effects of Microeconomic Reform, 1994; and Industry Commission, The Growth and Revenue Implications of Hilmer and Related Reforms, 1995.
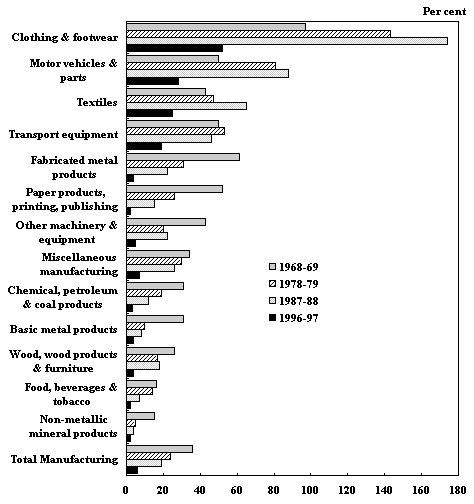
The removal or reduction of such assistance is a spur to reduced costs, improved productivity and a pattern of production that reflects commercial realities. Chart 15 shows that effective rates of assistance [8] for manufacturing industries as a whole have been reduced significantly in recent decades, particularly during the 1980s and 1990s. While considerable variation in rates of assistance remains across industries, there is much greater uniformity than was the case 20, or even 10, years ago.
CHART 15: EFFECTIVE RATES OF ASSISTANCE IN MANUFACTURING
The impact of such changes cannot be viewed in isolation from movements in the real exchange rate - ie movements in the nominal exchange rate adjusted for relative rates of inflation at home and abroad. As indicated in Chart 16, the real exchange rate has fallen considerably since the early 1980s; despite some more recent increases, the real exchange rate is currently about 25 per cent lower than it was in the early 1980s.
A lower real exchange rate will tend to moderate the effects of reductions in protection on import competing industry and provide a relative stimulus for export industry. In Australia, while manufacturing's share of overall production has continued to decline as in many other industrial countries, the share of some manufacturing activities has expanded - and some manufactured exports have increased considerably.
CHART 16: REAL EXCHANGE RATE(a)
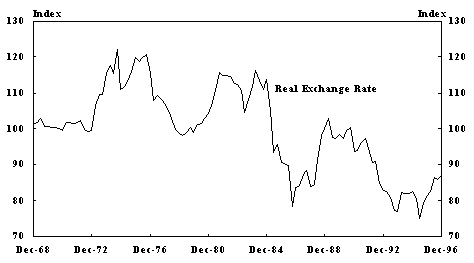
Sources: ABS Cat. No. 1364.0.
Overseas experience indicates that a greater focus on enterprise bargaining and increased wage flexibility across sectors and occupations helps to deliver better employment outcomes. The European Union, with relatively inflexible product and labour markets, had unemployment levels of around 10 per cent during the 1980s, and unemployment rates in Germany, France and Italy have risen to around 12 per cent over the past year. In contrast, in the United Kingdom - a European country that has instituted significant structural labour market reform - unemployment has fallen from around 10 per cent in the mid 1980s to around 6½ per cent today. The United States, with generally more flexible markets, averaged around 6½ per cent unemployment in the 1980s, much lower than in Europe, and unemployment has since fallen below 5½ per cent. In New Zealand, after a decade of major structural reforms, including reforms to the labour market, unemployment has fallen rapidly to just under six per cent from a peak of almost 11 per cent in 1991 (although New Zealand's GDP growth over that period has been less than Australia's).
A number of factors, however, complicate analysis of trends in aggregate productivity performance. Cyclical factors obscure recognition of structural improvements; for example, in the early stages of economic recovery, factor inputs may be used more intensively, resulting in increases in output and productivity. Moreover, productivity improvements are generally only incremental and so may only become apparent in aggregate data after a considerable period has elapsed.
Productivity measurement, too, is difficult, particularly in the increasingly important service industries. For example, deregulation of trading hours may have increased efficiency in wholesale and retail trade, one of the largest sectors in the economy. Yet extended shopping hours have actually decreased measured productivity on an hours worked basis as, in the absence of other indicators, measured output is indexed to sales (in effect there is no measurement at all of the improvement in service). Similarly, output in the financial sector is measured in terms of labour inputs and hence labour productivity is by definition unchanged, despite industry reports of large increases in output per worker in this sector partly as a result of deregulation. [9] These considerations suggest that the aggregate data may underestimate the true benefits of reform.
Despite the above difficulties, there are some indications that the improved productivity performance observed for particular industries is also becoming apparent at more aggregated levels. Movements in total factor productivity for the non-farm market sector since the early 1970s are shown in Chart 17. As expected, cyclical influences are apparent, even though the data have been expressed in terms of rolling averages. Nevertheless, even allowing for such influences in the first half of the 1990s, recent outcomes give support to the likelihood of a structural improvement in aggregate productivity performance over the 1990s. In particular, outcomes during the 1990s contrast with the general downward trend in productivity growth evident to the end of the 1980s, even though average productivity growth in the 1990s is not significantly above the 1980s experience. A very significant contributor to the improvement in aggregate outcomes over the 1990s appears to have been developments in the public enterprise sector, related to the substantial reforms of government business enterprises mentioned above. Since 1990, labour productivity levels in the public enterprise sector, which accounts for about 11 per cent of total output, have risen by around two-thirds.
CHART 17: TOTAL FACTOR PRODUCTIVITY GROWTH - NON-FARM MARKET SECTOR
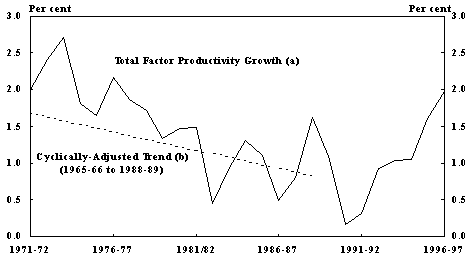
(b) The cyclically-adjusted trend has been derived by regressing annual total factor productivity growth for the period shown against a cyclical indicator and a time trend.
Source: ABS Cat. Nos. 5206.0, 5234.0 and Treasury estimates.
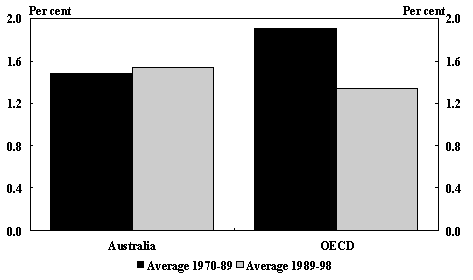
International comparisons also suggest positive productivity developments in Australia. Differences in national accounting conventions create problems in compiling and comparing capital stock estimates, making comparisons of total factor productivity particularly difficult. Concentrating on labour productivity growth, therefore, data from the latest OECD Economic Outlook (including forecasts through 1998) indicate that recent and expected performance in Australia compares favourably with the rest of the OECD. As indicated in Chart 18, average labour productivity growth in Australia in the 1990s is expected to be marginally above that in the 1970s and 1980s, an outcome broadly consistent with the outcomes for total factor productivity noted above. Nevertheless, what is most striking is that Australian experience contrasts sharply with the deceleration evident for the OECD as a whole in the 1990s relative to its earlier experience, highlighting the importance of microeconomic reforms in Australia in enabling these broader trends to be avoided.
CHART 18: LABOUR PRODUCTIVITY GROWTH: AUSTRALIA AND THE OECD
Despite Australia's better recent productivity growth performance (compared with the OECD as a whole), Australia's productivity level remains relatively low. An international comparison undertaken by the OECD [10] indicates that Australia's labour productivity level in manufacturing in the mid-1990s was the lowest of the 11 OECD countries analysed. For a limited range of service industries analysed, the same study concluded that Australia's productivity levels were high only in construction and air transport. Similarly, the BIE has estimated that Australian industry lags significantly behind world best practice levels of labour and capital productivity in industries such as electricity, telecommunications, rail freight, waterfront container movement, aviation, gas supply, coastal shipping and road freight [11]. These international comparisons of Australian productivity performance highlight the need for continued pursuit of reforms to enable ongoing efficiencies to be introduced, both to bridge the existing gap and to match further advances in world best practice.


