| |
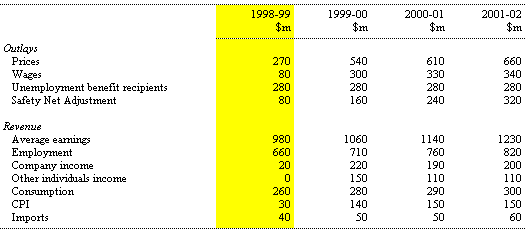
Table B1 provides a guide to the sensitivity of the forward estimates of outlays and revenue to variations in economic parameters in 1998-99. It is important to recognise that such guides provide only a ‘rule of thumb’ indication of the impact on the budget of changes in prices, wages and other parameters.
Table B1: Sensitivity of Fiscal Aggregates to a 1 Percentage Point Increase in Economic Parameters
On the outlays side, the sensitivity analysis of the estimates provides for the following assumptions about changes to four broad groups of parameters:
Projected outlays respond to changes in economic parameters through a variety of mechanisms. For example, the Government’s decision to maintain pensions at 25 per cent of Male Total Average Weekly Earnings (MTAWE) means that projected spending on pensions will depend not just on changes to the CPI, by which pensions have been indexed for some time, but also on expected changes in the level of MTAWE.
In addition, about $26 billion of underlying outlays, comprising running costs, other Commonwealth Own Purpose Outlays of a running cost nature and Specific Purpose Payments to the States of a running cost nature, are indexed to weighted averages of movements in underlying inflation and the Safety Net Adjustment (SNA) determined by the AIRC.
The items affected by prices and wages have been re-examined since the 1997-98 MYEFO. This has resulted in a compositional change between the sensitivity of prices and wages. In addition, the Government has introduced the Youth Allowance which has had the effect of reducing unemployment benefit recipients.
The number of unemployment benefit recipients, and therefore the total spending on benefits, are affected by economic growth and employment growth. However, the relationship between GDP growth and unemployment benefit recipients is highly variable and difficult to quantify. For this reason, Table B1 only includes the impact of changes in the number of unemployment benefit recipients (ie Newstart Allowance and unemployed Youth Allowance recipients) on the estimates.
On the revenue side, the figures show the estimated impact of a one percentage point change in a range of economic variables in 1998-99 as a whole. The CPI is assumed to increase by a quarter of one percentage point at the start of each quarter in 1998-99.
Differences in impact over the years reflect:
 |
 |