| |
This appendix discusses the revenue impacts associated with concessional taxation treatment of specific groups and/or activities.
Individuals and businesses derive financial benefits from various tax concessions. These concessions are usually delivered by tax exemptions, deductions, rebates or reduced rates. They can either reduce or delay the collection of tax revenue. The Government can use taxation concessions to allocate resources to different activities in much the same way that it can use direct expenditure programmes. For this reason, and noting their direct impact on the underlying budget deficit, these tax concessions are generally called ‘tax expenditures’.
A feature of the Government’s Charter of Budget Honesty is the requirement to publish an overview of tax expenditures as part of the budget.
Following a review of existing tax expenditures, first announced in the 1996-97 Budget, the Government has decided to undertake periodic monitoring and evaluation of all tax expenditures through normal budget processes to ensure they deliver Government assistance in an effective manner.
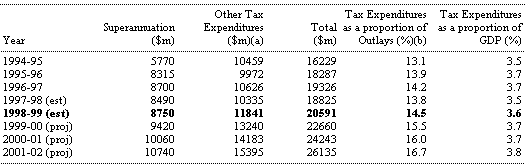
Table C1 shows estimates for the period 1994-95 to 2001-02 of the aggregate tax expenditures that have been identified and costed in the Tax Expenditures Statement 1996-97 (TES), which was published in December 1997. The availability of new information and decisions taken since the TES was published have led to a re-estimation of actual costs and forward projections for aggregate tax expenditures.
Table C1: Aggregate Tax Expenditures 1994-95 to 2001-02
(a) These aggregates do not include measures allowing delayed payments of tax.
(b) Outlays are reported on an underlying basis.
There are a number of major considerations in analysing aggregate tax expenditures.
Bearing these considerations in mind, Table C1 shows that the net cost of aggregate tax expenditures which provide a benefit or penalty to taxpayers (excluding timing measures), has increased by around $1 billion in the year to 1996-97. As a result, the ratio of tax expenditures to underlying budget outlays increased to 14.5 per cent in 1996-97, with it projected to rise to almost 17 per cent by 2001-02.
While tax expenditures are expected to rise as a proportion of outlays, they remain relatively stable as a proportion of GDP reflecting, in many cases, the fact that they are closely related to income growth.
Tax Expenditures by Functional Categories
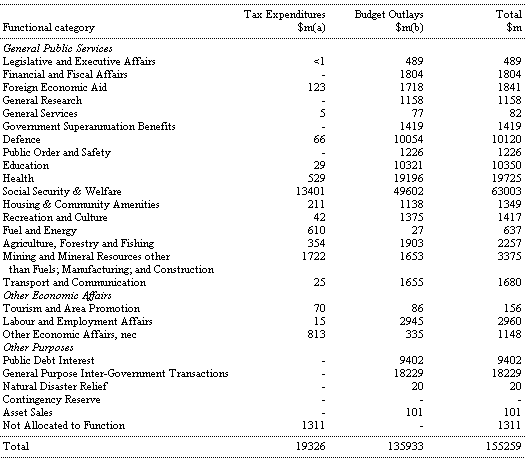
Table C2 compares the costs of identified tax expenditures in 1996-97 with underlying outlays by functional category. The functional categories are the same for outlays in this Statement.
The aggregates for a number of tax expenditure categories are only approximations as some tax expenditures do not lend themselves to easy categorisation. For example, it may not be possible to determine precisely which industry sectors have accessed tax concessions which are available to all industries. Tax expenditures that cannot be classified as belonging to a particular functional category are aggregated in the ‘Not Allocated to Function’ category.
Table C2 indicates there is considerable variation in the importance of tax expenditures to particular sectors of the economy. For example, while a relatively small level of assistance was provided through tax expenditures to the Education sector, about 96 per cent of the total Government assistance to the Fuel and Energy sector was provided in the form of tax expenditures.
The most significant category of tax expenditures was Social Security and Welfare, accounting for $13.4 billion, or about 70 per cent of total tax expenditures. This compares with the next largest category (Mining and Mineral Resources other than fuels, Manufacturing and Construction) at $1.7 billion or about 9 per cent of total tax expenditures.
Table C2: Aggregate Tax Expenditures and Direct Outlays by Functional Category, 1996-97
(a) Aggregate cost of tax expenditures in functional categories are derived by summing individual tax expenditure costings.(b) Outlays are reported on an underlying basis.
 |
 |