Document
Index
Budget Paper 1
Budget Statement 1



|
Document
Index |
|
|
The Budget maintains a sound fiscal outlook with surpluses in 1999-2000
and over the period of the forward projections. The fiscal balance for 1999-2000 is
expected to be in surplus by $5.4 billion, an increase from the $3.1 billion
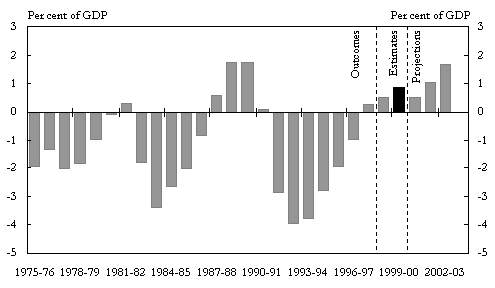
surplus expected in 1998-99. The underlying cash surplus for 1999-2000 is expected to be
$5.2 billion, a substantial increase from the expected outcome of $2.9 billion
in 1998-99 (these estimates allow for a reduction of around $1¼ billion
per year from Commonwealth payments for PTE superannuation provisions).
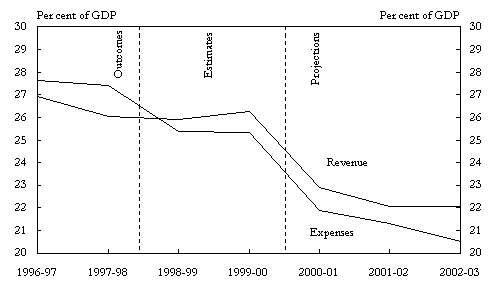
Chart 1 shows the recent outcomes, current estimates and projections for revenues,
expenses and the fiscal balance for the Commonwealth general government sector.
Chart 2 shows the underlying cash balance, again for the Commonwealth general
government sector, over a longer period.
Chart 1: Budget Balances(a)
Panel A: General Government Revenue and Expenses
Panel B: Fiscal Balance
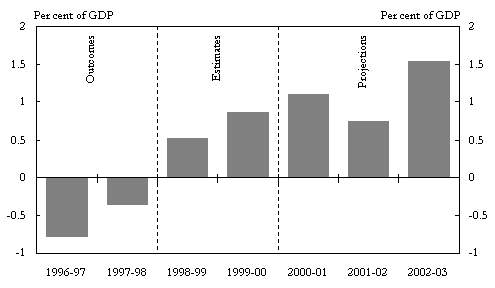
Chart 2: Underlying Cash Balance(a)
Over the forward estimates period, both revenue and expenses as a proportion of GDP are
expected to fall significantly. These reductions are largely driven by the abolition of
Financial Assistance Grants to the States and Territories, the abolition of Wholesale
Sales Tax and the personal income tax cuts arising from the introduction of A New Tax
System.
The major economic parameters underpinning the budget estimates are summarised in
Table 3. The economic forecasts are discussed in detail in Statement 2.
The economic parameters are based on forecasts for 1998-99 and 1999-2000 and medium-term
projections for the following three financial years. The projections for economic growth
in the outyears are based on an analysis of underlying trends, while the projections for
inflation are consistent with the mid-point of the medium-term inflation target band. The
impact on prices of the tax reforms under A New Tax System is not included in the
projections. However, this impact has been taken into account separately in projecting the
revenues and expenses affected by the tax reforms.
Table 3: Major Economic Parameters (percentage change from previous year)
| Forecasts | Projections | ||||
| 1998-99 | 1999-00 | 2000-01 | 2001-02 | 2002-03 | |
| Real GDP | 4¼ | 3 | 3½ | 3½ | 3½ |
| Employment(a) | 2¼ | 1¾ | 2 | 2 | 2 |
| Wages(b) | 4¼ | 3¾ | 3½ | 3½ | 3½ |
| CPI | 1¼ | 2 | 2½ | 2½ | 2½ |
Table 4 provides a reconciliation between the underlying cash estimates released at the time of the 1998-99 Budget and the 1998-99 MYEFO; and fiscal balance estimates at the time of the 1998-99 MYEFO and 1999-2000 Budget.
Table 4: Reconciliation of 1998-99 Budget, MYEFO and 1999-2000 Budget General Government Estimates(a)
| 1998-99 ($m) |
1999-00 ($m) |
2000-01 ($m) |
2001-02 ($m) |
|
| 1998-99 Budget underlying cash balance | 2778 | 4830 | 8613 | 14626 |
| (per cent of GDP) | 0.5 | 0.8 | 1.3 | 2.1 |
| Changes between 1998-99 Budget and 1998-99 MYEFO | ||||
| Effect of policy decisions(b) | ||||
| Revenue | -17 | 700 | -16611 | -17512 |
| Underlying outlays | -886 | -2479 | 11419 | 12029 |
| Total | -903 | -1779 | -5192 | -5483 |
| Effect of parameter and other variations | ||||
| Revenue | 1816 | -1448 | -1373 | -1451 |
| Underlying outlays | -659 | 1083 | 1335 | 1746 |
| Total | 1157 | -365 | -38 | 295 |
| 1998-99 MYEFO underlying cash balance | 3032 | 2686 | 3383 | 9438 |
| 1998-99 MYEFO fiscal balance(c) | 3580 | 1624 | 8240 | 8067 |
| Changes between 1998-99 MYEFO and 1999-2000 Budget | ||||
| Effect of policy decisions | ||||
| Revenue | -118 | -124 | -121 | -21 |
| Expenses | 140 | -965 | -1295 | -1472 |
| Capital | 5 | 0 | 113 | 55 |
| Depreciation adjustment | 5 | 26 | 12 | 1 |
| Total | 32 | -1063 | -1291 | -1437 |
| Effect of parameter and other variations | ||||
| Revenue | 243 | 4459 | -642 | -546 |
| Expenses | -833 | 291 | 659 | -590 |
| Capital(d) | -355 | -330 | -513 | -782 |
| Other adjustments(e) | 438 | 445 | 742 | 478 |
| Total | -507 | 4865 | 246 | -1440 |
| 1999-2000 Budget fiscal balance | 3105 | 5426 | 7195 | 5189 |
| (per cent of GDP) | 0.5 | 0.9 | 1.1 | 0.7 |
Parameter and other variations since the 1998-99 MYEFO reduce expenses in 1999-2000 and in 2000-01. This mainly reflects draw-downs in the conservative bias allowance[3], lower unemployment forecasts, reduced pension and benefit payments due to lower CPI forecasts, and lower than expected growth in beneficiary numbers. These are partially offset by increased expenses mainly associated with higher estimates of schools funding, residential aged care and higher education operating grants.
On the revenue side, parameter and other variations since the 1998-99 MYEFO have a net positive impact on revenue in 1999-2000 driven by higher individual and other income taxes, outweighing lower indirect tax revenue. Higher than expected dividend payments also substantially increase revenue in 1999-2000. In the outyears, parameter and other variations have a negative impact on revenue. This is mainly due to lower forecasts of customs and excise duty, as well as lower public debt interest revenues.
The 1999-2000 Budget provides for targeted new policy spending largely associated with meeting the Government's election commitments. Major policy decisions taken since the 1998-99 MYEFO include:
A full description of all policy decisions taken since the 1998-99 MYEFO can be found in Budget Paper No. 2.
Appendix C in Statement 4 contains a Statement of Risks which details potential factors which could materially affect the fiscal outlook. One important factor will be variations in the economic parameters. A discussion of the estimated sensitivity of the expenses and revenue estimates to changes in economic parameters is provided in Appendix B of Statement 4.
The 1999-2000 Budget has been framed against the Government's medium-term fiscal
strategy, consistent with the requirements of the Charter of Budget Honesty
Act 1998. The Charter requires the Government to set out its medium-term
strategy in each budget, along with its shorter-term objectives and targets. The
Government is also required to determine its fiscal objectives with regard to the
Charter's principles of sound fiscal management and report regularly on its progress in
achieving them.
The primary objective of the Government's medium-term fiscal strategy is to achieve fiscal
balance, on average, over the course of the economic cycle. This will ensure that, over
time, the Commonwealth general government sector makes no net call on private sector
saving and therefore does not directly contribute to the national saving-investment
imbalance (ie the current account deficit). Sustainable fiscal settings help promote
longer-term growth prospects by reducing Australia's vulnerability to external shocks and
allowing greater flexibility to adjust to changing economic conditions.
This objective, which previously applied to the underlying balance in the cash budgeting
framework, has not changed but has been redefined under the new accrual budget framework
to apply to its accrual counterpart, the fiscal balance. The fiscal balance closely
approximates the contribution of the Commonwealth to national net lending -- the
difference between national saving and investment. Differences between the fiscal balance
and the underlying cash balance, which are discussed in more detail in Appendix A to
this Statement, largely reflect the timing of bringing transactions to account.
The Government's supplementary fiscal targets will also be maintained under accruals,
albeit slightly reconfigured. In addition, the move to accruals provides scope to consider
an additional measure -- net assets. With the move to accruals and the budget
now returned to surplus, the medium-term fiscal objective has five supplementary fiscal
targets:
Substantial progress has already been achieved on the second and third of these targets, while tax revenue as a percentage of GDP has remained below the 1996-97 ratio.
The Government will run fiscal surpluses during periods of sound economic growth, so that deficits emerging during periods of low growth (if such occur) are manageable. Accordingly, a surplus is again forecast for 1999-2000 and current policy settings are projected to deliver fiscal surpluses over the forward estimates period (Chart 1).
The budget will remain in surplus over the forward estimates period under both the
accrual fiscal balance and the cash underlying balance measures. Nevertheless, the two
fiscal indicators will diverge in the short term. The fiscal balance will detect
non-monetary effects, such as increases in accruing superannuation entitlements that would
be ignored by the underlying cash balance. Conversely, the underlying cash balance will
detect cash transactions such as superannuation payouts (outlays) on previously accrued
liabilities that do not affect the fiscal balance.
The fiscal balance will generally provide a better indication of the ongoing impact of
current policy on the fiscal position because transactions are recognised when economic
value changes. The underlying cash balance has advantages in helping to identify the
short-term impact of the budget on demand.
The fiscal consolidation implemented by the Government has been a key ingredient in
Australia's recent strong economic performance. The Government's fiscal strategy and the
outlook for continuing surpluses have been important in sustaining financial market
confidence during the economic downturn in the East Asian region. These developments
underscore the continuing need to operate prudent fiscal policy and maintain a strong
fiscal position. This is discussed in more detail in Statement 3.
Improvements in the fiscal balance as a result of the Government's programme of fiscal
consolidation have been associated with increases in Commonwealth general government
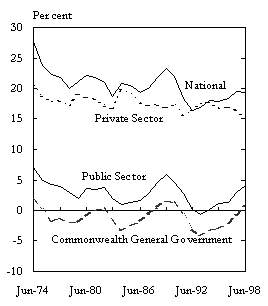
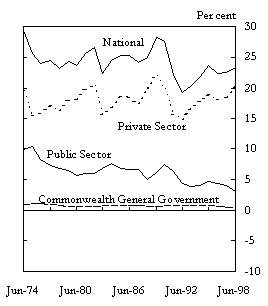
saving and public sector saving (Chart 3). These increases have helped maintain
overall national saving during a period of declining private saving.
With the budget now in surplus, the Commonwealth is no longer drawing on the available
pool of private saving; instead, it has become a net lender -- adding to the
pool of saving available to fund private investment. Moreover, its contribution to
national net lending is expected to increase over the forward estimates period. With the
State/local general government sector and the PTE sector also expected to be in surplus
over the forward estimates period, both the Commonwealth and the public sector as a whole
should contribute to reducing the current account deficit (CAD) over time. Projected
developments in the State/local general government and PTE sectors are discussed in detail
in Statement 9.
Chart 3: Ratios of Gross Saving and Investment to GDP
Saving |
Investment |
Source: ABS Cat. No. 5204.0 and Treasury estimates.
International evidence suggests that higher public saving tends to raise national
saving. While some private saving response to fiscal consolidation might be expected,
experience indicates that this only partly offsets the improvement in public saving.
Chart 3 shows that national saving in Australia has normally improved when public
saving has improved, and fallen when public saving has fallen. Abstracting from the
long-term decline in private saving, which does not appear to be related to public saving
trends, movements in national saving have clearly been strongly influenced by
movements in Commonwealth general government saving.
To the extent that past Commonwealth borrowing may have `crowded out' private investment
by raising interest rates, a sound fiscal policy may encourage private investment. Private
investment should generally produce benefits in terms of higher future incomes that
justify the costs of servicing external borrowing.
The fiscal strategy means that the CAD is now essentially a product of private saving and
investment decisions that reflect market disciplines and incentives. Much has been done to
reduce distortions to private saving and investment that have existed in the past, through
the achievement of low inflation and structural and financial market reform (see
Statement 3). In this environment, the fiscal strategy provides assurance to
financial markets that the CAD reflects soundly based private sector decisions.
Improvements in the Commonwealth's net assets and net debt positions help to reduce Australia's vulnerability to economic shocks by reducing the risk of adverse swings in financial market confidence. Improving the Commonwealth's balance sheet will also help to ensure that the Government is better placed to cope with any emerging fiscal pressures (such as those caused by the ageing of the population) and is able to meet its future obligations without requiring sharp changes in policy settings at later -- and possibly less opportune -- times.
Chart 4: Commonwealth General Government Net Debt(a)
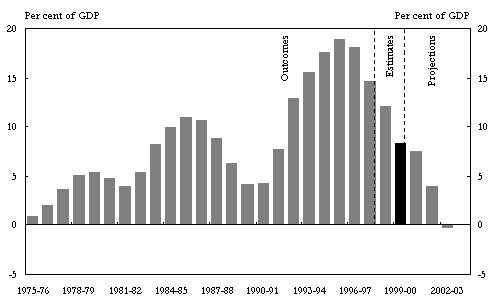
As shown in Chart 4, the Government's fiscal strategy has been successful in
reducing the level of Commonwealth general government net debt over recent years. The
Government has not borrowed, in net terms since its election in 1996. From a peak of
18.8 per cent of GDP in 1995-96, net debt levels are expected to fall as a share
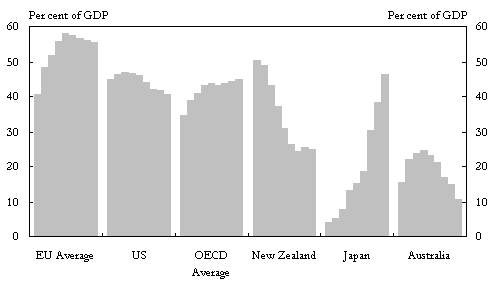
of GDP to 8.2 per cent in 1999-2000. This compares with average net debt levels
of around 43 per cent of GDP for OECD countries since the mid-1990s (see
Chart 5).
The fiscal surpluses in prospect in each of the forward estimates years, along with
expected proceeds from Commonwealth asset sales, provide for further substantial
reductions in net debt. As shown in Chart 4, the Government's target of halving the
ratio of Commonwealth general government net debt to GDP over the five years to 2000-01 is
expected to be exceeded by a substantial margin. Indeed, with the further sale of Telstra,
by the end of the forward estimates period in 2002-03 Commonwealth general government net
debt could be completely eliminated.
Chart 5: Total General Government Net Debt Levels
in Selected Countries 1992 to 2000(a)(b)
Source: OECD Economic Outlook 64, Reserve Bank of New Zealand Monetary Policy Statement, March 1999, ABS Public Sector Financial Assets and Liabilities (Cat. No. 5513.0) and Treasury estimates.
The 1999-2000 Budget incorporates, for the first time, a statement of financial position, or balance sheet, showing the Commonwealth's overall assets and liabilities. In addition to the longer-standing objective of reducing net debt, which covers selected financial assets and liabilities of the Commonwealth, the introduction of the accrual framework provides the opportunity to introduce an objective for net assets, which covers all the physical and financial assets and liabilities of the Commonwealth.
| Box 2: Measuring Net Assets and Net Debt The net assets and debt positions of the Commonwealth are reported in the balance sheet. Net assets include physical as well as financial assets less total liabilities. Net debt, on the other hand, comprises selected financial liabilities (deposits held, advances received and borrowing) less selected financial assets (cash and deposits, advances paid and investments). The net debt measure is accordingly a subset of the broader net assets measure. Net debt, however, is a measure widely used for purposes of international comparisons by international organisations and ratings agencies. Changes in net assets result from movements in the operating result over time, as well as from asset and liability revaluations. Revaluations can cause significant, and unpredictable, movements in net asset values that governments are not able to control. The extent to which governments are able to control net asset movements in the medium to long term is achieved through the control they have over operating balances. Due to the potential volatility of the net assets measure, particularly as the move to accrual budgeting is being consolidated, the Government has not targeted a specific net assets level, but has adopted the objective of improving the Commonwealth's net asset position over the medium to long term. |
There are important reasons for governments to track their net assets positions over time, reflecting the extent to which this provides insights into their intergenerational positions. For example, while negative net asset levels do not imply insolvency for governments, as they may do for private profit making enterprises, a significant negative net assets position, particularly if it is expected to deteriorate, may be considered unsustainable and indicate an inequality between current and future generations. This inequality reflects the extent to which high past and/or current period spending by governments may limit the fiscal options open to governments in future periods. Reflecting a desire to address this issue, the Government has set as an objective an improved Commonwealth net assets position over the medium to long term. This objective is consistent with the Government's broader fiscal responsibility objectives set out in the Charter of Budget Honesty Act 1998.
Chart 6: Commonwealth General Government Net Assets
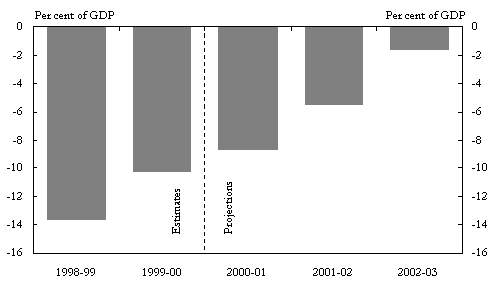
Chart 6 illustrates recent trends, current estimates and projections in Commonwealth net asset levels as a share of GDP. The level of net assets as a percentage of GDP is currently estimated at -13.6 per cent. This level is projected to improve over the forward estimates period, consistent with the Government's objective to improve its net assets position over the medium to long term. This reflects the expected operating surpluses. An additional factor contributing to this improvement is the proposed sale of the remainder of the Government's share in Telstra. In line with accounting standards, Telstra is currently recorded in the Commonwealth's balance sheet at book value[4], which is significantly below its expected market value. That is, the estimate of the Government's current net asset position is, in fact, distorted by this valuation issue. As Telstra is sold, however, this undervaluation is undone, contributing to the significant improvement in the measure of net assets.
The achievement of budget surpluses has largely relied on expenses restraint. While
maintaining overall restraint on expenses, in this Budget the Government is carefully
targeting high priority areas such as health, education, research and development,
employment, rural and regional Australia, and families.
The Government's budget priorities are spelt out in greater detail in Part IV of this
Statement.
A feature of the move to accrual budgeting is a greater emphasis on the reporting of
capital expenditure by the Commonwealth. For the first time, Budget Paper No. 1
includes a separate capital funding statement -- Statement 7.
The tax reform package outlined in A New Tax System is consistent with the
Government's medium-term fiscal strategy. In particular, this fiscal strategy commits the
Government to maintain fiscal surpluses while growth continues and to not increase the
overall tax burden.
A New Tax System will be implemented progressively from 1999-2000 and will reduce
the size of the Commonwealth surplus estimated for that year and projected for subsequent
years. The package will bring substantial benefits to the operation of the economy and to
the sustainability of Commonwealth government and State government finances.
Reflecting the considerable improvements in the Government's fiscal position in recent
years, the tax package can be accommodated while retaining budget surpluses through the
forward estimates period.