
Document
Index
Budget Paper 1
Budget Statement 9



|
Document
Index |
|
|
This Statement examines trends in underlying rather than headline cash deficits. The
underlying measure excludes net advances -- the transfer or exchange of
financial assets, which have no impact on government net lending or net assets. For the
Commonwealth general government sector, net advances mainly comprise the proceeds of
equity asset sales and State debt repayments to the Commonwealth.
The underlying cash deficit used in this statement up until 1998-99 differs from the ABS
deficit measure by not excluding increases in provisions. This is to maintain consistency
with the ABS national accounts, in which the classification standard for provisions
changed in response to the introduction of the System of National Accounts, 1993
(SNA 93). The difference is further explained in the statistical notes at Appendix C
to this Statement.
The underlying cash deficit may not translate directly into changes in net debt. This is
mainly because the proceeds of equity asset sales are classified under net advances, and
excluded from the underlying cash deficit. However, such proceeds result in lower
borrowing requirements (or repayment of previous borrowings) and therefore lower net debt.
The historical data used in the remainder of Statement 9 have been drawn from the
most recent ABS Government Financial Estimates and Public Financial Assets and
Liabilities (FALs) publications. Preliminary 1998-99 data and projections for the
States were compiled by the Commonwealth Treasury, drawing on general government sector
information provided by the States for their Mid Year Reports, updated where possible for
recent State budgets. Projections for the Commonwealth incorporate the parameter
assumptions which underlie the Commonwealth Budget forward estimates.
The Commonwealth government exerts the major influence on non-financial
public sector balances in Australia, largely through its substantial general government
sector. The PTE sector has a smaller effect on the total and tends to be more important at
the State/local level, where most PTEs are concentrated.
Chart 1 shows movements in the non-financial public sector deficit as a share of GDP,
and the relative contributions of the general government and PTE sectors. In recent
decades the non-financial public sector has recorded consistent deficits, apart from a
small surplus in 1988-89. The deficit peaked at 4.7 per cent of GDP in 1992-93 before
declining to 0.3 per cent in 1996-97. This succession of deficits added
significantly to the government's net lending requirements, and hence to Australia's
current account deficit.
However, Chart 1 shows that the non-financial public sector moved into a surplus
position in 1997-98, with further surpluses projected in the period to 2002-03.[2] This improvement largely reflects the fiscal consolidation
measures adopted by the Commonwealth.
Chart 1: Non-Financial Public Sector Underlying Cash Deficit by
Sector
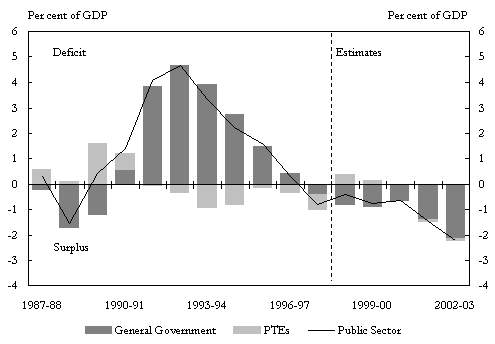
Chart 1 also shows the declining contribution of the PTE sector to
the non-financial public sector deficit, in line with the increasing privatisation of
government businesses since the late 1980s. The PTE sector is expected to contribute only
modestly to non-financial public sector balances over the projection period.
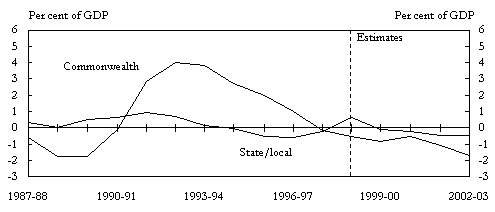
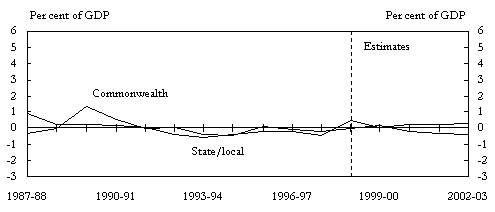
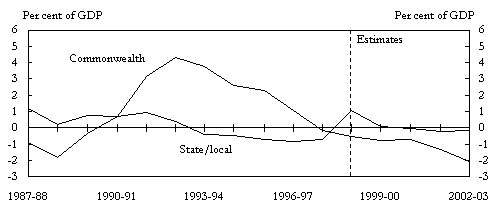
Chart 2 disaggregates the deficits presented in Chart 1 by level of government.
It shows the large contribution of past Commonwealth general government cash deficits to
the non-financial public sector cash deficit. It also illustrates the recent improvements
in the Commonwealth general government sector balance as a result of the Government's
fiscal consolidation programme.
The consolidated PTE sector is close to balance, and the State general government sector
is projected to remain in small surplus over the outyears. Thus the Commonwealth general
government surplus is the driver behind the expected consolidated public sector surplus of
0.8 per cent of GDP in 1999-2000, increasing to 2.2 per cent of GDP in
2002-03.
Chart 2: Underlying Cash Deficit by Sector and Level of Government
A: General Government
B: Public Trading Enterprises
C: Non-financial Public Sector
The general government sector is the appropriate primary focus for an
assessment of the impact of the public sector on the national economy. It accounts for
around 90 per cent of total public sector revenues and outlays and is the sector
through which the national government may seek to affect the level of private sector
activity. The increased commercial orientation of the PTE sector means that it operates
more like the private sector. Its contribution to total public sector balances in the
current decade has been minor.
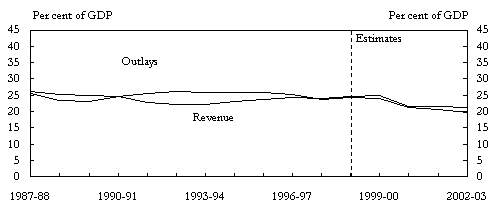
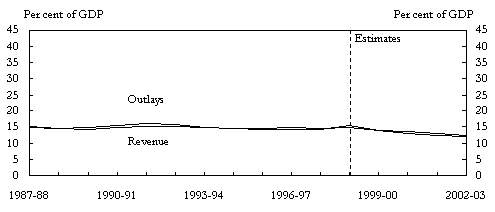
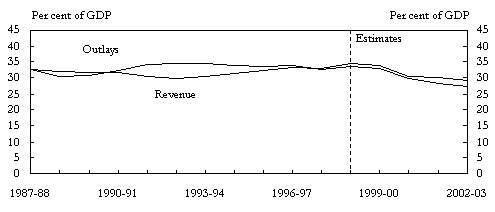
Chart 3 shows trends in general government cash underlying outlays and revenue at the
Commonwealth and State/local levels. Underlying outlays are consistent with the underlying
cash deficit, in that they exclude net advances paid. Panel A shows the
countercylical relationship between the Commonwealth's outlays and cash revenues.
Generally, during economic downturns, such as in the early 1990s, outlays on transfer
payments rise and taxation revenues fall, with the reverse happening during periods of
strong economic growth. However, the Commonwealth deficits recorded in the first half of
the 1990s also reflect structural factors. Outlays were maintained at a high level of GDP
during the cyclical upturn, while the low inflation environment depressed the growth in
revenue receipts.
As shown in Panel A of Chart 2, the Commonwealth general government sector is
expected to move from a cash deficit of 1.0 per cent of GDP in 1996-97 to a cash
surplus of 0.8 per cent of GDP in 1999-2000, increasing to
1.7 per cent in 2002-03. Panel A of Chart 3 shows that this
improvement is being achieved through a reduction in outlays as a share of GDP, from
25.4 per cent in 1996-97 to a projected 19.7 per cent in
2002-03 -- the lowest level since the early 1970s. Cash revenue is also expected to
fall during this period, from 24.4 per cent in 1996-97 to a projected
21.4 per cent in 2002-03. These falls are largely as a result of the Commonwealth's
planned tax reforms.
The recent process of fiscal consolidation has been achieved mainly through outlays
restraint. This reflects the Government's view that expenditure control holds the key to
achieving sustainable improvements in the fiscal position, and that scope has existed for
rationalising programmes and making government more efficient. The IMF and OECD have found
that fiscal consolidation is more likely to be durable and encourage sustained economic
growth if it is achieved through outlays restraint rather than through tax increases,
which tend to be syphoned off into higher spending.
State/local revenue and outlays are less sensitive to the economic cycle than Commonwealth
finances. Panel A of Chart 2 shows the sustained improvement in the State/local
general government balances achieved over the period 1991-92 to 1996-97, from a deficit of
1.0 per cent of GDP to a cash surplus of 0.6 per cent of GDP. As shown
in Panel B of Chart 3, this improvement has largely reflected outlays restraint,
helped by lower debt servicing charges, with State/local revenue broadly stable as a share
of GDP.
Chart 3: General Government Cash Underlying Outlays and Revenue
by Level of Government
A: Commonwealth
B: State/local
C: Consolidated General Government
However, in 1998-99 the State/local general government sector cash balance
is expected to reverse its recent series of small surpluses and move to a deficit of
0.6 per cent of GDP. This sharp turnaround in 1998-99 is due to NSW and Victoria
allocating an additional $3 billion and $2.5 billion respectively to meeting
their unfunded superannuation liabilities. The increased superannuation contribution
pushes up the States' levels of current expenditure, and thus their budget deficits for
the year, by a corresponding amount. Without these one-off superannuation payments, the
State/local general government cash balance for 1998-99 would have been a surplus of
around 0.4 per cent of GDP.
Small State/local general government cash surpluses are expected to prevail over the
projection period. As shown in Panel B of Chart 3, outlays are projected to
decline as a share of GDP. This is mainly due to restraint in current outlays resulting
from improvements in public sector efficiency and interest savings associated with
declining net debt. Both grants from the Commonwealth and cash own source revenue are
also projected to decline as a share of GDP over the outlook period, the latter partly
reflecting policies in several States which explicitly seek to restrain tax levels.
All States and Territories have in place medium-term fiscal strategies aimed at improving
their fiscal positions over the medium term. These are discussed further in Budget
Paper No. 3 -- Federal Financial Relations. While there remain
significant fiscal and economic disparities between the States, any movement towards
increased State/local general government cash surpluses will supplement the positive
effect of fiscal consolidation at the Commonwealth level, contributing to a lower current
account deficit.
Panels A and C of Chart 3 show the influence of outlays restraint at the
Commonwealth level on total general government cash outlays and balances. Consolidated
general government outlays are projected to fall by more than six percentage points from
the 1992-93 level of 34.4 per cent to 28.1 per cent of GDP in 2002-03,
which is lower than most other OECD countries.
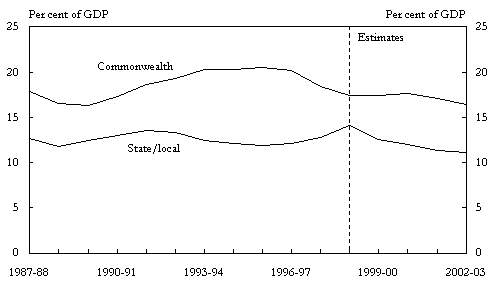
Trends in general government cash own purpose outlays are illustrated
in Chart 4. Commonwealth own purpose outlays are defined here as cash underlying
outlays, adjusted mainly to exclude Commonwealth payments to the States other than
specific purpose payments made `through' the States. This differs from the equivalent ABS
measure which excludes all payments to the States, including payments `through' the
States. (The methodology is explained in more detail in Appendix C.) While not
without its limitations, the adjusted measure provides a better basis for comparison of
relative outlays restraint by the Commonwealth and State/local levels of government.
As shown in Chart 4, Commonwealth general government cash own purpose outlays
increased as a proportion of GDP in the six year period to 1995-96, in contrast to a
declining trend for the State/local level from 1991-92.
The projections for the Commonwealth show falling own purpose outlays as a share of GDP
over the period to 2002-03 as a result of the Government's fiscal consolidation measures.
A decline is also expected for the State/local level, after the abnormally high figure
caused by NSW and Victoria increasing their superannuation funding in 1998-99.
Chart 4: General Government Cash Own Purpose Underlying Outlays
by Level of Government
The PTE sector is an important provider of economic infrastructure and contributes
significant revenue to general government, mainly in the form of dividends (as discussed
in Part IV). Where the general government sector is dominated by the Commonwealth,
State/local government activity is more significant within the PTE sector. This reflects
State responsibility for infrastructure and service provision in areas such as
electricity, gas and water and public transport.
During the 1980s, the PTE sector engaged in high levels of capital
accumulation (particularly the publicly-owned power providers), with associated
growth in debt levels and interest costs. This added significantly to public sector
deficits over this period. However, since the late 1980s, with the introduction of
corporatisation and privatisation policies, the PTE sector has recorded a series of small
cash surpluses. There has been greater emphasis on PTE operating efficiency, profitability
and market orientation, often as a precursor to privatisation, and governments have
re-evaluated the appropriateness of continued public ownership of many business
enterprises.
PTE privatisations over the last decade have occurred in two main sectors --
electricity and gas (eg Victoria's electricity assets), and transport and communications
(eg Qantas and the one-third sale of Telstra). Proceeds of asset sales have been used
largely to reduce, or contain the growth of government net debt, resulting in ongoing
savings in public debt interest.
The 1995 Competition Principles Agreement between the Commonwealth and the States provides
a framework for ongoing change within the PTE sector. The Agreement introduced a
generalised regime for access to essential infrastructure facilities, set out principles
which apply to the reform of public sector monopolies, and initiated competitive
neutrality principles that ensure that government businesses do not enjoy competitive
advantages over private sector competitors as a result of their public ownership.
As shown in Chart 1, the PTE sector has maintained a cash surplus position through much of
the 1990s. However, 1998-99 sees the PTE sector moving to an underlying cash deficit of
0.4 per cent of GDP. This is a result of substantial privatisation in the
Victorian PTE sector 1998-99, with proceeds going back to the general government sector to
retire debt and reduce the state's unfunded superannuation liability. Projections indicate
that the sector will move back to small surpluses over the remainder of the outlook
period, in line with economic growth and continued reform within remaining businesses.

