Document
Index
Budget Paper 1
Budget Statement 9



|
Document
Index |
|
|
This part examines trends in non-financial public sector net debt and in net interest and dividend flows. As discussed in Part II, the level of net debt and debt servicing costs are important indicators of a jurisdiction's financial position. Governments in Australia have accorded a high priority to debt reduction in order to reduce the debt servicing burden, and enhance policy flexibility.
Net debt comprises the stock of selected gross financial liabilities less
financial assets, and broadly reflects the cumulative effect of underlying cash balances.
However, the change in net debt does not correspond exactly to the cash underlying deficit
as the proceeds of equity transactions (such as equity asset sales), which reduce the
borrowing task, are classified as net advances and as such are not included in the cash
underlying balance. Also, changes in net debt may reflect other factors such as
revaluations of financial assets and liabilities.
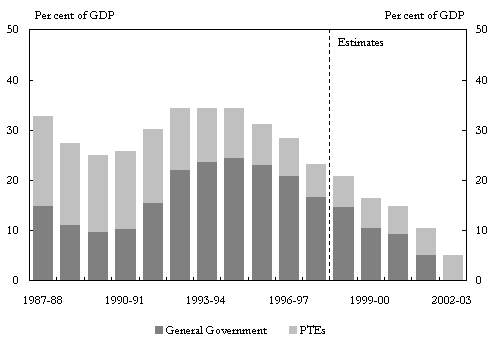
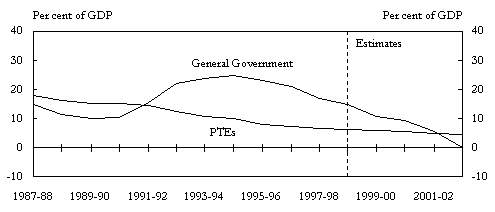
Chart 5 shows non-financial public sector net debt as a percentage of GDP, and the
contribution of the general government and PTE sectors, since the late 1980s.
Chart 5: Non-financial Public Sector Net Debt by Sector
(as at end of financial year)
Charts 1 and 5 together indicate the broad relationship between
underlying deficits and net debt levels.
Chart 5 shows the increase in general government net debt as a share of GDP following
the last recession. This increase reflected the financing of Commonwealth cash budget
deficits that continued into the cyclical upturn. Also evident from Chart 5 is the
decline in PTE sector net debt as a share of GDP since the late 1980s, reflecting lower
levels of capital expenditure, improved efficiency and privatisations. This decline
moderated the increase in total public sector net debt as a share of GDP in the first half
of the 1990s.
The subsequent improvement in total net debt mainly reflects lower net borrowing
requirements for the Commonwealth and the application of privatisation proceeds to debt
retirement at both the Commonwealth and State/local levels.
General government net debt as a share of GDP is expected to decline further over the
projection period, due mainly to Commonwealth fiscal consolidation. PTE sector net debt as
a share of GDP is projected to decline slowly, in line with the expected pattern of small
PTE sector cash surpluses.
Total public sector net debt is projected to be only 5.0 per cent of GDP in
2002-03, compared with the most recent peak of 34.4 per cent in 1992-93. The
application of any future privatisation proceeds to debt reduction would result in even
lower debt levels.
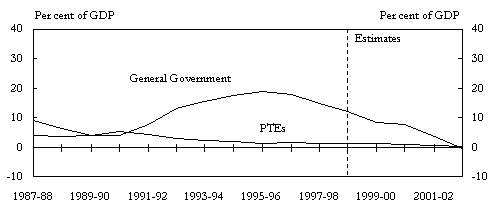
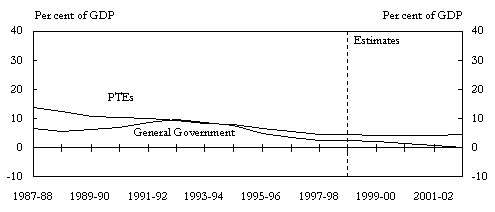
Chart 6 shows trends in net debt by sector and level of government. The usefulness of
comparisons is diminished by the fact that between levels of government the distribution
of debt across institutional sectors differs widely. Most Commonwealth net debt is owned
by the general government sector whereas more than half of State/local net debt is owned
by the PTE sector.
As shown in Panel A of Chart 6 Commonwealth general government net debt as a
share of GDP grew from low levels in the late 1980s to a peak of 18.8 per cent
in 1995-96, with strong growth in the first half of the 1990s.
In contrast, State/local general government net debt grew only modestly in the early
1990s, and has since declined from a peak of 9.6 per cent in 1992-93 to around
2.7 per cent in 1997-98, as shown in Panel B. This improvement within the
State/local general government sector reflects both the impact of asset sales, and fiscal
consolidation during the second half of the 1990s.
The projections for the Commonwealth in Panel A of Chart 6 include the expected
impact of measures announced in this Budget. These projections show that Commonwealth
general government sector net debt is projected to decline from a peak of
18.8 per cent of GDP in 1995-96 to around 7.4 per cent in 2000-01,
consistent with the Government's announced aim of halving the net debt to GDP ratio over
this period. The Commonwealth general government is projecting a small negative net
debt figure for 2002-03.
Chart 6: Non-Financial Public Sector Net Debt
by Level of Government and Sector
(Outstanding Stock as at End of Financial Year)
A: Commonwealth
B: State/local
C: Consolidated Non-financial Public Sector
State/local general government net debt as a share of GDP should continue to fall in line with the debt reduction programmes being pursued by the States as part of their medium term fiscal strategies. State/local general government net debt is expected to be close to zero by the end of the projection period. However, some individual States continue to face substantial net debt burdens (see Budget Paper No. 3 -- Federal Financial Relations for more information).
Net interest outlays are defined as interest payments on gross debt less
interest received on loans and advances, and are affected by the volume of net debt on
issue and interest rates.
Chart 7 shows the trend in general government net interest payments by level of
government.
Chart 7: General Government Net Interest Outlays
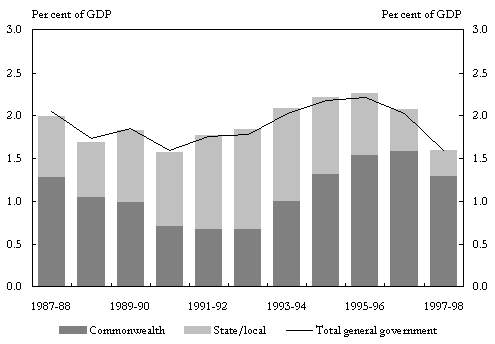
As shown in Chart 7, total general government net interest outlays
peaked in 1995-96 at around 2.2 per cent of GDP. Levels of this magnitude were
previously reached in the mid 1980s when both net debt and interest rates were high. High
net interest outlays during the mid-90s climate of relatively lower interest rates, and
lower levels of State/local general government net debt, reflected ongoing Commonwealth
budget cash deficits during the expansionary phase of the economic cycle.
The contribution of the PTE sector to public sector net interest outlays has decreased
significantly over the last decade and a half, as reduced capital outlays, improved PTE
performance and privatisations have reduced PTE sector net debt as a share of GDP.
The PTE sector provides the general government sector (particularly at the State/local
level) with significant revenue in the form of dividends and interest payments. Dividends
correspond to general government equity holdings while interest payments reflect the stock
of general government loans to the PTE sector.
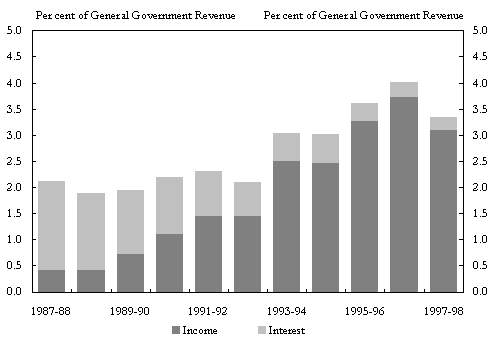
Chart 8 shows the effect of PTE restructuring on these revenue sources. As PTEs have
become more commercial in focus, and less directly controlled by government, they have
refinanced general government advances in the market and adopted capital structures and
dividend policies more comparable with those applying in the private sector.
Notwithstanding the impact of privatisations, in recent years the PTE sector has paid
increasing dividends to its general government owners due to improved profitability and
the adoption of commercial dividend policies. The amount of income transferred to general
government by PTEs has increased from 0.4 per cent of general government revenue
in 1987-88 to 3.1 per cent in 1997-98. This has more than offset a decline in
interest paid.
Chart 8: Income and Interest Transferred from PTEs to
General Government Sector