Document
Index
Budget Paper 3



|
Document
Index |
|
|
This chapter discusses trends in Commonwealth payments to the States and outlines the
arrangements for payments to the States and local government in 1998-99 and
1999-2000.
Table 6 shows estimated Commonwealth total payments to the States after allowing for
State fiscal contributions to the Commonwealth and payments associated with the Gun
Buyback Scheme.
Total payments are estimated to increase by $1,503.8 million or 4.5 per cent
in nominal terms and 2.5 per cent in real terms in 1999-2000.
Table 6: Commonwealth Payments to the States, 1998-99 and 1999-2000
($million, estimated)
| General Revenue Assistance |
Specific Purpose Payments |
State Fiscal Contributions |
Total Payments |
Change |
|||
| (1) | (a) (2) |
(3) | (1)+(2)-(3) | Nominal | Real (b) | ||
| $m | Per cent | Per cent | |||||
| 1998-99 | 17013.3 | 16642.0 | 313.4 | 33341.9 | 1817.5 | 5.8 | 4.3 |
| 1999-00 | 17719.6 | 17126.2 | 0.0 | 34845.7 | 1503.8 | 4.5 | 2.5 |
Table 7 shows estimated total Commonwealth payments for each State in 1998-99 and
1999-2000.
In net terms, Commonwealth payments to the States are estimated to be $34.4 billion in
1999-2000, an increase of $2,337.0 million or 7.3 per cent on 1998-99. The estimated net
increase incorporates SPPs direct to local government authorities ($241.0 million in
1998-99 and $258.3 million in 1999-2000) and total repayments to the Commonwealth by
the States of $1,549.4 million in 1998-99 and $733.5 million in 1999-2000.
Table 7: Total Commonwealth Payments to the States, 1998-99 and
1999-2000 ($million, estimated)
| NSW | VIC | QLD | WA | SA | TAS | ACT | NT | Total | ||
| 1998-99 | ||||||||||
| (1) | General Revenue Assistance | 4800.8 | 3582.5 | 3234.5 | 1635.5 | 1685.2 | 742.1 | 307.2 | 1025.7 | 17013.3 |
| (2) | Total Specific Purpose Payments | 5452.2 | 3813.9 | 2990.8 | 1843.6 | 1433.9 | 494.6 | 290.4 | 322.8 | 16642.0 |
| Specific Purpose Payments 'to' the States (a) | 4179.7 | 2820.5 | 2289.6 | 1434.0 | 1148.6 | 394.9 | 206.6 | 267.1 | 12740.9 | |
| Specific Purpose Payments 'through' the States (b) | 1272.5 | 993.5 | 701.1 | 409.6 | 285.3 | 99.6 | 83.8 | 55.6 | 3901.1 | |
| (3) | Gross Payments to the States (1) + (2) | 10252.9 | 7396.4 | 6225.3 | 3479.1 | 3119.0 | 1236.6 | 597.6 | 1348.5 | 33655.3 |
| (4) | State Fiscal Contributions | 101.5 | 74.5 | 55.4 | 29.4 | 23.7 | 15.6 | 10.2 | 3.0 | 313.4 |
| (5) | Total Payments to States (3) - (4) | 10151.5 | 7321.8 | 6169.9 | 3449.7 | 3095.3 | 1221.0 | 587.3 | 1345.4 | 33341.9 |
| 1999-00 | ||||||||||
| (1) | General Revenue Assistance | 5179.5 | 3636.5 | 3318.9 | 1637.4 | 1715.9 | 793.5 | 362.1 | 1075.8 | 17719.6 |
| (2) | Total Specific Purpose Payments | 5615.6 | 3967.9 | 3082.3 | 1879.3 | 1451.2 | 490.9 | 316.9 | 322.1 | 17126.2 |
| Specific Purpose Payments 'to' the States (a) | 4238.1 | 2896.6 | 2326.2 | 1441.1 | 1141.8 | 382.9 | 226.7 | 260.6 | 12914.2 | |
| Specific Purpose Payments 'through' the States (b) | 1377.4 | 1071.2 | 756.1 | 438.2 | 309.4 | 108.0 | 90.2 | 61.5 | 4212.0 | |
| (3) | Gross Payments to the States (1) + (2) | 10795.1 | 7604.4 | 6401.1 | 3516.7 | 3167.1 | 1284.4 | 679.1 | 1397.9 | 34845.7 |
| (4) | State Fiscal Contributions | 0.0 | 0.0 | 0.0 | 0.0 | 0.0 | 0.0 | 0.0 | 0.0 | 0.0 |
| (5) | Total Payments to States (3) - (4) | 10795.1 | 7604.4 | 6401.1 | 3516.7 | 3167.1 | 1284.4 | 679.1 | 1397.9 | 34845.7 |
| Change in Total Payments, 1998-99 to 1999-00 $million | 643.6 | 282.6 | 231.2 | 67.0 | 71.8 | 63.4 | 91.7 | 52.5 | 1503.8 | |
| Nominal change, per cent | 6.3 | 3.9 | 3.7 | 1.9 | 2.3 | 5.2 | 15.6 | 3.9 | 4.5 | |
In 1999-2000, general revenue assistance to the States will take the form of FAGs, SRA
and NCPs. In contrast to most SPPs, general revenue assistance is `untied', that is, it is
not required to be spent by the States in a specified area.
General revenue assistance is estimated to amount to $17.7 billion in 1999-2000,
an increase of 4.2 per cent on the previous year. The estimates of general
revenue assistance for 1999-2000 have varied from those presented at the
1999 Premiers' Conference in line with movements in the CPI.
Table 8 sets out general revenue assistance by type of payment and State for the
period 1995-96 to 1999-2000.
Table 8: General Revenue Assistance to the States, 1995-96 to 1999-2000 ($million)
| NSW | VIC | QLD | WA | SA | TAS | ACT | NT | Total | |
Financial Assistance Grants (a) |
|||||||||
| 1995-96 | 4225 | 2997 | 2884 | 1546 | 1501 | 651 | 227 | 891 | 14921 |
| 1996-97 | 4372 | 3220 | 2981 | 1538 | 1503 | 666 | 233 | 921 | 15435 |
| 1997-98 | 4546 | 3339 | 3099 | 1568 | 1551 | 680 | 237 | 970 | 15991 |
| 1998-99 (b) | 4728 | 3529 | 3195 | 1614 | 1668 | 737 | 279 | 1024 | 16773 |
| 1999-00 (b) | 5031 | 3527 | 3237 | 1594 | 1681 | 783 | 342 | 1071 | 17267 |
Special Revenue Assistance |
|||||||||
| 1995-96 | 182 | 232 | 0 | 0 | 0 | 0 | 61 | 10 | 485 |
| 1996-97 | 188 | 240 | 0 | 0 | 0 | 0 | 42 | 10 | 480 |
| 1997-98 | 190 | 242 | 0 | 0 | 0 | 0 | 35 | 0 | 467 |
| 1998-99 (b) | 0 | 0 | 0 | 0 | 0 | 0 | 25 | 0 | 25 |
| 1999-00 (b) | 0 | 0 | 0 | 0 | 0 | 0 | 13 | 0 | 13 |
National Competition Payments |
|||||||||
| 1995-96 | 0 | 0 | 0 | 0 | 0 | 0 | 0 | 0 | 0 |
| 1996-97 | 0 | 0 | 0 | 0 | 0 | 0 | 0 | 0 | 0 |
| 1997-98 | 72 | 53 | 39 | 21 | 17 | 5 | 4 | 2 | 213 |
| 1998-99 (b) | 73 | 54 | 40 | 21 | 17 | 5 | 4 | 2 | 216 |
| 1999-00 (b) | 148 | 109 | 81 | 43 | 35 | 11 | 7 | 4 | 439 |
Identified Road Grants (c) |
|||||||||
| 1995-96 | 110 | 99 | 68 | 43 | 28 | 11 | 3 | 9 | 371 |
| 1996-97 | 113 | 93 | 72 | 41 | 33 | 13 | 4 | 14 | 383 |
| 1997-98 | 0 | 0 | 0 | 0 | 0 | 0 | 0 | 0 | 0 |
| 1998-99 | 0 | 0 | 0 | 0 | 0 | 0 | 0 | 0 | 0 |
| 1999-00 | 0 | 0 | 0 | 0 | 0 | 0 | 0 | 0 | 0 |
| Total General Revenue Assistance | |||||||||
| 1995-96 | 4517 | 3328 | 2952 | 1589 | 1529 | 662 | 291 | 910 | 15777 |
| 1996-97 | 4673 | 3553 | 3053 | 1579 | 1535 | 680 | 279 | 945 | 16298 |
| 1997-98 | 4808 | 3634 | 3139 | 1589 | 1568 | 686 | 275 | 972 | 16671 |
| 1998-99 (b) | 4801 | 3582 | 3235 | 1635 | 1685 | 742 | 307 | 1026 | 17013 |
| 1999-00 (b) | 5179 | 3637 | 3319 | 1637 | 1716 | 793 | 362 | 1076 | 17720 |
Table 9 sets out general revenue assistance by type of payment for the period 1998-99
to 2002-03.
Table 9: General Revenue Assistance to the States, 1998-99 to 2002-03 ($million,
estimated)
| 1998-99 | 1999-00 | 2000-01 | 2001-02 | 2002-03 | |
| Financial Assistance Grants | 16772.5 | 17267.2 | na | na | na |
| Special Revenue Assistance | 25.0 | 13.2 | 13.5 | 13.9 | 14.2 |
| National Competition Payments | 215.8 | 439.1 | 450.1 | 692.1 | 709.4 |
| Grants to Balance State Budgets (a)(b) | na | na | na | 1217.6 | 516.7 |
| Total | 17013.3 | 17719.6 | 463.7 | 1923.6 | 1240.3 |
At the 1999 Premiers' Conference, the Commonwealth maintained total FAGs for
1999-2000 in real per capita terms. In 1999-2000, FAGs to the States are expected to
total $17,267.2 million with the real terms adjustment and the per capita
adjustment estimated to contribute $293.2 million and $201.5 million
respectively. Final amounts will depend on the actual increase in the CPI for the
four quarters to March 1999 and March 2000, the Australian Statistician's
determination of the population at 31 December 1998 and
31 December 1999 and final figures for HCGs.
The 1996 Premiers' Conference agreed that the untied funds, which were previously
paid to the States as identified road grants, would be absorbed into the FAGs pool from
1997-98. Table 10 shows the equivalent amount of each State's FAGs in 1999-2000.
Table 10: Addition to FAGs from the Absorption of Untied Identified Road Grants,
1999-2000 ($million, estimated)
| NSW | VIC | QLD | WA | SA | TAS | ACT | NT | Total | |
| 1999-00 | 124.3 | 87.5 | 76.3 | 38.2 | 38.8 | 16.2 | 7.3 | 20.2 | 408.8 |
The distribution of FAGs among the States is based on the States' populations as at
31 December of each year and the corrected per capita relativities assessed by
the Commonwealth Grants Commission (CGC) in the Report on General Revenue Grant
Relativities 1999. (The CGC issued corrected relativities on 29 March 1999, which
took into account revisions to State revenues.)
The per capita relativities are applied to the State populations in order to arrive
at a weighted population share for each State. A State's FAGs are equal to its
weighted population share of the combined pool of FAGs and unquarantined HCGs, less the
unquarantined HCGs it receives.
Tables 11 and 12 set out the estimated distribution of FAGs for 1998-99 and
1999-2000, respectively.
The redistribution of the combined pool of FAGs and HCGs among the States implied by the
1999 relativities reflects a number of broad influences.
Table 11: Financial Assistance Grants to the States, 1998-99 (estimated)
| NSW | VIC | QLD | WA | SA | TAS | ACT | NT | Total | |
| (1) Estimated population as at 31 December 1998 (000's) (a) | 6376.4 | 4684.6 | 3482.4 | 1846.8 | 1490.7 | 471.1 | 308.8 | 191.5 | 18852.3 |
| (2) Per capita relativities (b) | 0.87765 | 0.88042 | 1.02186 | 0.98252 | 1.22194 | 1.55086 | 0.95145 | 4.81869 | na |
| (3) Weighted populations (000's) - (1) times (2) | 5596.3 | 4124.4 | 3558.5 | 1814.5 | 1821.6 | 730.7 | 293.8 | 922.6 | 18862.3 |
| (4) Share of each State in weighted population (per cent) (c) | 29.7 | 21.9 | 18.9 | 9.6 | 9.7 | 3.9 | 1.6 | 4.9 | 100.0 |
| (5) Pool of FAGs and unquarantined HCGs distributed according to (4) ($m) (d) | 6573.4 | 4844.5 | 4179.9 | 2131.4 | 2139.6 | 858.2 | 345.1 | 1083.6 | 22155.8 |
| (6) Unquarantined HCGs ($m) (d) | 1845.6 | 1315.7 | 985.2 | 517.0 | 471.5 | 121.6 | 66.5 | 60.1 | 5383.2 |
| (7) Total FAGs - (5) less (6) ($m) (e) | 4727.8 | 3528.8 | 3194.7 | 1614.3 | 1668.1 | 736.7 | 278.6 | 1023.5 | 16772.5 |
| NSW | VIC | QLD | WA | SA | TAS | ACT | NT | Total | |
| (1) Estimated population as at 31 December 1999 (000's) (a) | 6446.6 | 4736.9 | 3537.3 | 1879.5 | 1499.0 | 470.0 | 310.7 | 194.9 | 19074.9 |
| (2) Per capita relativities (b) | 0.89948 | 0.86184 | 1.00687 | 0.94793 | 1.20680 | 1.60905 | 1.10270 | 4.84429 | na |
| (3) Weighted populations (000's) - (1) times (2) | 5798.6 | 4082.4 | 3561.6 | 1781.6 | 1809.0 | 756.3 | 342.6 | 944.0 | 19076.1 |
| (4) Share of each State in weighted population (per cent) (c) | 30.4 | 21.4 | 18.7 | 9.3 | 9.5 | 4.0 | 1.8 | 4.9 | 100.0 |
| (5) Pool of FAGs and unquarantined HCGs distributed according to (4) ($m) (d) | 6974.2 | 4910.1 | 4283.7 | 2142.9 | 2175.8 | 909.6 | 412.1 | 1135.3 | 22943.7 |
| (6) Unquarantined HCGs ($m) (d) | 1943.2 | 1382.6 | 1046.3 | 548.8 | 494.3 | 127.0 | 70.4 | 64.0 | 5676.5 |
| (7) Total FAGs - (5) less (6) ($m) | 5031.1 | 3527.5 | 3237.4 | 1594.1 | 1681.4 | 782.6 | 341.8 | 1071.3 | 17267.2 |
Further information is provided in Table 13 below and in the CGC's Report on General
Revenue Grant Relativities 1999.
Table 13: Effects of the Commonwealth Grants Commission's 1999 Review Relativities
($million)(a)(b)
| Cause | NSW | VIC | QLD | WA | SA | TAS | ACT | NT |
| Data Changes | ||||||||
|
3.8 | -21.0 | 40.5 | 0.6 | -2.2 | 2.8 | -7.8 | -16.7 |
|
-3.1 | 26.4 | -43.2 | -20.2 | 43.7 | 8.0 | 3.1 | -14.7 |
| Methodology Changes | ||||||||
|
113.7 | -27.9 | -67.1 | -18.4 | -10.8 | -12.2 | -6.6 | 29.2 |
|
-1.6 | -54.4 | 37.2 | -2.4 | 18.1 | 7.1 | -15.1 | 11.2 |
|
59.0 | -19.4 | -56.3 | 6.4 | -12.5 | -15.9 | 18.5 | 20.2 |
|
105.3 | -35.9 | -17.3 | 14.7 | -100.6 | 25.8 | 38.9 | -30.7 |
| Sub-Total | 277.0 | -132.3 | -106.2 | -19.2 | -64.3 | 15.6 | 31.0 | -1.5 |
| Advancing the Review Period (substituting 1997-98 for 1992-93) |
-111.6 | 32.4 | 46.5 | -54.5 | 38.7 | 16.8 | 24.0 | 7.7 |
| Total Redistribution | 165.3 | -99.9 | -59.7 | -73.8 | -25.6 | 32.4 | 55.1 | 6.2 |
At the April 1995 Council of Australian Governments meeting, the Commonwealth and
the States concluded the Agreement to Implement the National Competition Policy and
Related Reforms. Under the Agreement the States are eligible for
three tranches of ongoing NCPs. The NCPs commenced in July 1997 at an annual level of
$200 million and are scheduled to increase to $400 million and $600 million in
July 1999 and July 2001 respectively, in 1994-95 prices. The Agreement specifies that the
NCPs be paid quarterly and be distributed to the States on an equal per capita basis.
Each State's NCPs are subject to the State making satisfactory progress with the
implementation of specified reform conditions in the Agreement. Prior to the scheduled
payment of NCPs in 1999-2000, the National Competition Council (NCC) will assess whether
each State has met these conditions and provide a report for consideration by the
Commonwealth.
Subject to satisfactory progress in the areas to be reviewed by the NCC, the Commonwealth
will provide the States with NCPs estimated to total $439.1 million in 1999-2000.
Table 14 shows the allocation of NCPs in 1998-99 and 1999-2000.
Table 14: National Competition Payments, 1998-99 and 1999-2000 ($million,
estimated)(a)
| NSW | VIC | QLD | WA | SA | TAS | ACT | NT | Total | |
| 1998-99 | 73.0 | 53.6 | 39.9 | 21.1 | 17.1 | 5.4 | 3.5 | 2.2 | 215.8 |
| 1999-00 | 148.4 | 109.1 | 81.4 | 43.3 | 34.5 | 10.8 | 7.2 | 4.5 | 439.1 |
In 1999-2000 SRA will comprise funding to the Australian Capital Territory (ACT) in the
form of transitional allowances and special fiscal needs. The level of these payments will
reflect the recommendations of the CGC in its Report on General Revenue Grant
Relativities 1999.
Transitional allowances are designed to assist with the ACT's transition to `State-like'
funding from the generous levels of Commonwealth funding which existed before
self-government. In 1999-2000, transitional allowances will amount to $9.3 million, a
reduction of $1.8 million. This amount recognises that the ACT continues to have limited
policy control over policing, and will be reassessed once Stage Two of the
Commonwealth-ACT review of policing is completed around mid 1999.
Special fiscal needs are payments to the ACT in recognition that certain
functions (for example, the Family Court) are not funded by the Commonwealth, whereas
in other States funding arrangements exist between the Commonwealth and the State. In
1999-2000, special fiscal needs will amount to $3.9 million, a decrease of $10.0 million
from 1998-99. This decrease reflects the CGC's decision not to continue assessing a
special fiscal need for items of a capital nature. In the view of the CGC, the
introduction of a depreciation assessment into its standard budget framework will take
into account the ACT's need to fund recurrent expenditure associated with capital needs.
Table 15 sets out the impact on the distribution of general revenue assistance of
revised population figures for 1999-2000, the 1999 per capita relativities, changes
in the level of NCPs and changes in the distributions of HCGs and SRA.
Table 15: Factors Affecting the Change in General Revenue Assistance, 1998-99 to
1999-2000 ($million, estimated)
| 1998-99 General Revenue Assistance |
FAGs Pool Redistributions |
FAGs Indexation |
Special Revenue Assistance(c) |
National Competition Payments |
1999-00 General Revenue Assistance |
|||
Relativities(a) |
New Population Estimates |
Change in Distribution of Health Care Grants(b) |
||||||
| NSW | 4800.8 | 166.2 | -4.8 | -8.4 | 150.4 | 0.0 | 75.4 | 5179.5 |
| VIC | 3582.5 | -100.4 | -2.7 | -4.2 | 105.9 | 0.0 | 55.4 | 3636.5 |
| QLD | 3234.5 | -59.7 | 16.4 | -6.3 | 92.4 | 0.0 | 41.6 | 3318.9 |
| WA | 1635.5 | -74.2 | 12.1 | -4.3 | 46.2 | 0.0 | 22.1 | 1637.4 |
| SA | 1685.2 | -25.7 | -12.9 | 5.0 | 46.9 | 0.0 | 17.4 | 1715.9 |
| TAS | 742.1 | 32.6 | -12.4 | 6.2 | 19.6 | 0.0 | 5.4 | 793.5 |
| ACT | 307.2 | 55.0 | -2.2 | 1.4 | 8.9 | -11.8 | 3.6 | 362.1 |
| NT | 1025.7 | 6.2 | 6.5 | 10.6 | 24.5 | 0.0 | 2.3 | 1075.8 |
| Total | 17013.3 | 0.0 | 0.0 | 0.0 | 494.7 | -11.8 | 223.3 | 17719.6 |
On 5 August 1997 the High Court ruling on tobacco franchise fees in New South
Wales (Ha and Lim v. New South Wales and Walter Hammond & Associates Pty Ltd
v. New South Wales) cast into doubt the constitutional validity of all State business
franchise fees (BFFs). BFFs on tobacco, alcohol and petroleum generated State revenues of
around $5 billion annually.
On 6 August 1997, at the unanimous request of the States, the Commonwealth
announced `safety net' arrangements to protect State finances. These arrangements provided
for:
All revenue collected by the Commonwealth under these arrangements is returned to the
States (less administrative costs) as revenue replacement payments (RRPs).
The States have acknowledged that these arrangements represent State taxes imposed and
collected by the Commonwealth at the request and on behalf of the States. The distribution
of RRPs between the States was agreed among the States.
Details of estimated RRPs for 1998-99 and 1999-2000 are set out in Table 16. Actual RRPs
in 1998-99 and 1999-2000 will be in accordance with formal determinations to be made by
the Commissioner of Taxation and the Chief Executive Officer of the Australian Customs
Service under the States Grants (General Purposes) Act 1994.
These `safety net' arrangements will cease from 1 July 2000 under the proposed
reforms to Commonwealth-State financial relations.
Table 16: Revenue Replacement Payments, 1998-99 and 1999-2000
($million, estimated)
| NSW | VIC | QLD | WA | SA | TAS | ACT | NT | Total | |||
| 1998-99 | |||||||||||
| Tobacco | Share | (Per cent) | 0.32492 | 0.21803 | 0.19065 | 0.11100 | 0.08988 | 0.03226 | 0.01456 | 0.01870 | 1.00000 |
| Amount | ($m) | 1013.8 | 680.3 | 594.9 | 346.3 | 280.4 | 100.7 | 45.4 | 58.3 | 3120.2 | |
| Petroleum | Share | (Per cent) | 0.30039 | 0.20153 | 0.19593 | 0.17118 | 0.07549 | 0.02453 | 0.01291 | 0.01804 | 1.00000 |
| Amount | ($m) | 757.2 | 508.0 | 493.9 | 431.5 | 190.3 | 61.8 | 32.5 | 45.5 | 2520.7 | |
| Alcohol | Share | (Per cent) | 0.33796 | 0.22332 | 0.19314 | 0.11147 | 0.07857 | 0.02415 | 0.01569 | 0.01569 | 1.00000 |
| Amount | ($m) | 337.1 | 222.7 | 192.6 | 111.2 | 78.4 | 24.1 | 15.6 | 15.6 | 997.4 | |
| Total | 2108.1 | 1411.0 | 1281.4 | 889.0 | 549.1 | 186.6 | 93.6 | 119.5 | 6638.3 | ||
| 1999-00 | |||||||||||
| Tobacco(a) | Share | (Per cent) | 0.32492 | 0.21803 | 0.19065 | 0.11100 | 0.08988 | 0.03226 | 0.01456 | 0.01870 | 1.00000 |
| Amount | ($m) | 1004.1 | 673.8 | 589.2 | 343.0 | 277.8 | 99.7 | 45.0 | 57.8 | 3090.3 | |
| Petroleum | Share | (Per cent) | 0.30039 | 0.20153 | 0.19593 | 0.17118 | 0.07549 | 0.02453 | 0.01291 | 0.01804 | 1.00000 |
| Amount | ($m) | 783.7 | 525.8 | 511.2 | 446.6 | 197.0 | 64.0 | 33.7 | 47.1 | 2609.0 | |
| Alcohol | Share | (Per cent) | 0.33796 | 0.22332 | 0.19314 | 0.11147 | 0.07857 | 0.02415 | 0.01569 | 0.01569 | 1.00000 |
| Amount | ($m) | 355.4 | 234.8 | 203.1 | 117.2 | 82.6 | 25.4 | 16.5 | 16.5 | 1051.5 | |
| Total | 2143.2 | 1434.4 | 1303.5 | 906.9 | 557.3 | 189.1 | 95.2 | 121.4 | 6750.9 | ||
General purpose assistance to local government has been provided by the Commonwealth
since 1974-75, but will become the responsibility of the States and the Northern Territory
from 1 July 2000 under the Intergovernmental Agreement on the Reform of
Commonwealth-State Financial Relations (see Appendix B). Under current arrangements,
the Commonwealth provides general purpose assistance to local government in the form of
local government financial assistance grants and local government untied road funding.
This assistance is paid to the States as an SPP on the condition that the funds are passed
on to local government.
General purpose assistance is provided to local government authorities under the Local Government
(Financial Assistance) Act 1995 (the Act). Under the Act, the
Treasurer is responsible for determining the annual increase in Commonwealth general
purpose assistance paid to local government. The Act provides for general purpose
assistance to be increased each year by an escalation factor which reflects the underlying
movement in general revenue assistance provided to the States. The escalation factor
reflects the percentage increase in the States' FAGs pool in the current year, which in
turn reflects indexation for population growth and the CPI.
The Commonwealth will provide $1,227.8 million in local government general purpose
assistance in 1998-99. These payments have been based upon the estimated escalation factor
of 3.0 per cent determined by the Treasurer and take into account an
overpayment of $10.0 million in 1997-98. In June 1999, the Treasurer will
determine the 1998-99 final escalation factor on the basis of the actual payments made to
the States in 1998-99.
In 1999-2000, general purpose assistance to local government will be based upon an
estimated escalation factor of 2.9 per cent determined by the Treasurer. The
1999-2000 escalation factor reflects both the estimated CPI increase and population
growth. General purpose assistance to local government is estimated to be
$1,263.3 million in 1999-2000, after allowing for an estimated overpayment of
$5.7 million in 1998-99. The Treasurer will determine the final escalation factor for
1999-2000 in June 2000, on the basis of the actual payments made to the States in
1999-2000.
Table 17 sets out the payments of general purpose assistance to local government
in 1998-99 and 1999-2000.
As in the past, the interstate distribution of local government FAGs for 1999-2000 will be
on an equal per capita basis, using the State populations at 31 December in the
previous financial year. Untied local government road funding is to be distributed between
the States on the basis of the criteria established under the Australian Land Transport
Development Act 1988. In both cases, State Grants Commissions determine the
intrastate distribution of these payments to local governments on the basis of fiscal
equalisation.
Table 17: General Purpose Assistance for Local Government, 1998-99 and
1999-2000, ($million, estimated)
| NSW | VIC | QLD | WA | SA | TAS | ACT | NT | Total | |
| 1998-99 | |||||||||
| Financial Assistance Grants | 287.9 | 211.2 | 156.6 | 82.7 | 67.7 | 21.5 | 14.1 | 8.6 | 850.4 |
| Identified Road Grants | 109.5 | 77.8 | 70.7 | 57.7 | 20.7 | 20.0 | 12.1 | 8.8 | 377.4 |
| Total General Purpose Assistance (a) | 397.4 | 289.0 | 227.3 | 140.4 | 88.4 | 41.5 | 26.2 | 17.5 | 1227.8 |
| 1999-00 | |||||||||
| Financial Assistance Grants | 296.0 | 217.0 | 162.1 | 85.5 | 69.2 | 21.9 | 14.4 | 9.0 | 875.0 |
| Identified Road Grants | 112.7 | 80.0 | 72.7 | 59.4 | 21.3 | 20.6 | 12.5 | 9.1 | 388.3 |
| Total General Purpose Assistance (a) | 408.6 | 297.0 | 234.8 | 144.9 | 90.5 | 42.4 | 26.9 | 18.1 | 1263.3 |
Specific Purpose Payments (SPPs) are payments for policy purposes related to particular
functional activities (for example, health and education). SPPs are made under
Section 96 of the Constitution, which states that the Parliament may grant financial
assistance to any State on such terms as it sees fit.
There are around 120 SPPs which can be classified into three groups:
SPPs are reviewed every year in the Budget context. Indexation arrangements and the
distribution of SPPs among States vary for each SPP.
In most cases SPPs are subject to conditions reflecting Commonwealth policy objectives or
national policy objectives agreed to between the Commonwealth and the States. It is
because of the conditions attached to SPPs that they are sometimes called `tied grants'.
Such conditions may include:
SPPs also include some payments which are not subject to conditions. These typically relate to revenue sharing arrangements or compensation (either for the transfer of responsibilities or for other Commonwealth action). For example, compensation payments are made to the States for revenue forgone as a result of the national system of companies and securities regulation.
In 1999-2000 SPPs are estimated to total around $17.1 billion, an
increase of $474.5 million or 2.8 per cent, on 1998-99. SPPs `to' the
States are expected to increase by around $173.3 million in 1999-2000 or 1.4 per
cent, after abstracting from SPPs associated with the Gun Buyback Scheme
($78.8 million in 1998-99) and deductions from Commonwealth-State Housing Agreement
funding for State fiscal contributions ($69.1 million in 1998-99).
Measures in the 1999-2000 Budget have increased SPPs `to' the States by $94.0 million in
1999-2000 and by $716.8 million over the forward estimates period.
SPPs are expected to account for around 49 per cent of total gross payments to
the States in 1999-2000. SPPs `to' the States are expected to total $12.9 billion or
around 37 per cent of the total. Chart 7 shows trends in SPPs as a
proportion of total gross payments `to' and `through' the States. The chart also contains
adjustments for a number of classification changes and large one-off factors so as to
allow comparisons on a consistent basis[2].
Chart 7 shows that although SPPs have increased as a percentage of total Commonwealth
payments to the States by around 12 percentage points over the last twenty years, most of
this increase occurred in the period to the early 1990s. In recent years, SPPs have
declined as a percentage of gross payments to the States. In the Intergovernmental
Agreement on the Reform of Commonwealth-State Financial Relations which was signed by
the Commonwealth and the States at the 1999 Premiers' Conference, the Commonwealth has
indicated that it has no intention of cutting aggregate SPPs as part of the reform process
set out in the Agreement.
Chart 7: Specific Purpose Payments as a Percentage of Total Gross
Payments to the States, 1979-80 to 1999-2000
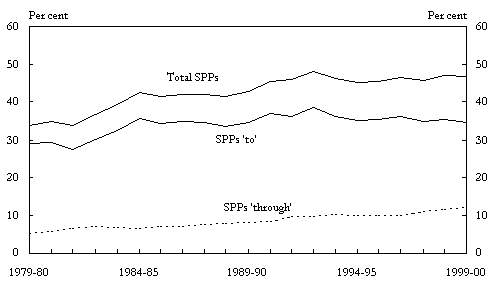
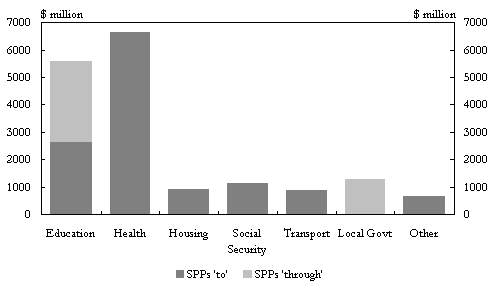
Chart 8 illustrates the composition of major specific purpose programmes (`to' and `through' the States) in 1999-2000. Health accounts for 51 per cent (or over $6.5 billion) of SPPs `to' the States. More detailed information on SPPs including estimated State splits for 1998-99 and 1999-2000 and data on repayments of advances, advances and interest payments are contained in Appendix A.
Chart 8: Composition of Estimated Specific Purpose Payments `To' and
`Through' the States, 1999-2000