
Document
Index
Budget Paper 3



|
Document
Index |
|
|
Federal fiscal arrangements in Australia are characterised by a significant difference between the relative revenue and expenditure responsibilities of the Commonwealth and the States, often referred to as vertical fiscal imbalance (VFI). The amount of own-source revenue raised by the Commonwealth is considerably larger than its own-purpose outlays. In contrast, the States' own-purpose outlays outweigh the amount which they raise in own-source revenue, with Commonwealth grants to the States forming a considerable portion of total State revenues. Chart 3 shows the estimated composition of general government own-source revenue and own-purpose outlays in Australia in 1998-99. Own-purpose outlays have been adjusted to include Commonwealth grants `through' the States (other than for local government purposes) and grants to the multi-jurisdictional sector and to exclude net advances.
Chart 3: Composition of General Government Own-Source Revenue and
Adjusted Own-Purpose Outlays, 1998-99 (estimated)
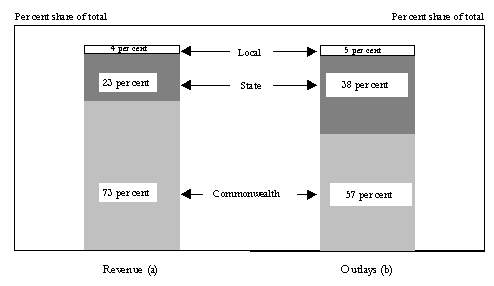
Chart 4: Impact of Commonwealth General Government Payments
to Other Levels of Government, 1998-99 (estimated)(a)
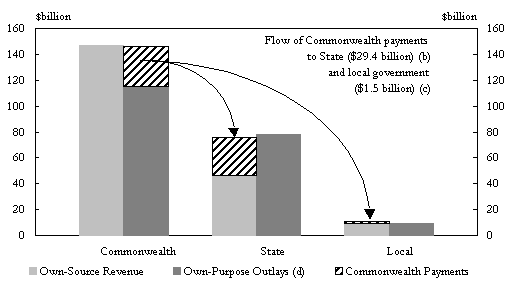
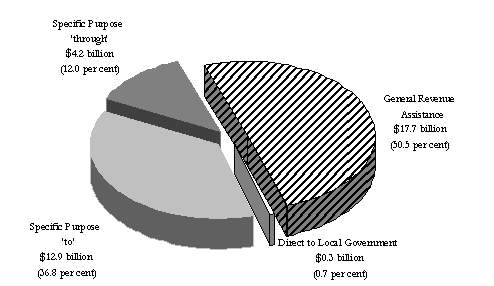
Chart 5 shows the composition of Commonwealth payments to the State/local sector in 1999-2000. Chapter III discusses these payments in detail.
Chart 5: Payments to the State/Local Sector in 1999-2000 (estimated)
Total Gross Payments $35.1 billion
The Commonwealth collects a range of taxes on behalf of State and Territory
Governments. These include revenues collected under the Section 90 `safety net'
arrangements (following the 5 August 1997 High Court decision on Business Franchise Fees
in the case of Ha and Lim v. New South Wales), mirror taxes at Commonwealth
places (following the 14 November 1996 High Court decision in the Allders case),
and from 2000-01, the GST.
Table 3 provides estimates of the taxes to be collected on an agency basis by the
Commonwealth for the States and Territories between 1998-99 and 2002-03. The estimates of
revenues for the GST are based on the proposed tax arrangements set out in A New Tax
System, and take account of proposed technical and other amendments introduced in the
Senate prior to the 1999-2000 Budget.
Table 3: Revenue Collected by the Commonwealth on Behalf of the States, 1998-99 to
2002-03 ($million, estimated)
| 1998-99 | 1999-00 | 2000-01 | 2001-02 | 2002-03 | |
| 'Safety Net' Surcharge Collections(a) | 6646 | 6759 | 348 | na | na |
| Mirror Taxes | 123 | 127 | 111 | 115 | 120 |
| GST | na | na | 27409 | 32290 | 33259 |
| Total | 6769 | 6886 | 27868 | 32405 | 33379 |
The general revenue assistance provided to the States by the Commonwealth is largely
distributed on the basis of the horizontal fiscal equalisation (HFE) principles which are
embodied in the per capita relativities recommended by the Commonwealth Grants Commission
(CGC). The CGC is an independent statutory authority established by the Commonwealth
Grants Commission Act 1973. The objective of HFE is to improve equity for all
Australian residents.
In its assessments, the CGC uses a complex methodology that takes account of differences
in the per capita capacities of the States to raise revenues and differences in the per
capita amounts required to be spent by the States in providing an average standard of
government services. A State's actual per capita expenditure or revenue generally differs
from the average of all States for two reasons:
HFE requires that only those factors beyond a State's control be taken into account in
determining a State's relative needs and hence the distribution of Commonwealth general
revenue grants. The CGC's recommendations seek to ensure that each State has the capacity
to provide the average standard of State-type public services if it makes the same effort
to raise revenue as the States on average and operates at an average level of efficiency.
An update of the relativities is conducted annually by the CGC in response to terms of
reference provided to it each year by the Commonwealth Government. The CGC also conducts
broader methodology reviews every five years and completed its most recent review in
February 1999 (see Box 1). The resulting changes to the CGC's methodology were
incorporated into the CGC's recommended relativities for 1999-2000. As noted in
Chapter I, the 1999 Premiers' Conference agreed that the per capita relativities
to be applied in 1999-2000 would continue to be based on the five year assessment
period which has been used since 1990-91. Accordingly, the assessment period for the
per capita relativities to be applied in 1999-2000 spans the years 1993-94
to 1997-98.
By international standards, the extent of HFE in Australia is pronounced and the
methodology is complex. The complexity of the CGC's processes has arisen in response to
the requirements of the States and the Commonwealth over time for a comprehensive and
rigorous approach to HFE. For its part, the CGC has sought to maximise the transparency of
its methodology and to provide the opportunity for input and comment by the States and the
Commonwealth.
Further information on HFE is provided in the CGC's Report on General Revenue Grant
Relativities 1999.
Box 1: Commonwealth Grants Commission's 1999 Methodology
Review
|
The distribution of the pool of FAGs and HCGs in accordance with the CGC's relativities
means that New South Wales, Victoria and Western Australia receive less than an equal per
capita share of the pool, and the other States (particularly the Northern Territory and
Tasmania) receive more. This reflects the CGC's assessment that the `donor' States have
greater relative revenue capacities and/or less significant expenditure disabilities than
the other States.
Table 4 shows the amount of FAGs and HCGs received by each State under HFE relative to the
amount that they would receive on the basis of an equal per capita distribution or a
distribution based on personal income tax collections. The table shows that
in 1999-2000, around $1,690 million (or 7.4 per cent) of the FAGs/HCGs
pool is to be redistributed among the States as a result of the application of the CGC's
relativities, compared with an equal per capita distribution.
Table 4: Impact of Horizontal Fiscal Equalisation on the Distribution of the Pool of
Financial Assistance Grants and Health Care Grants in 1999-2000(a)
Distribution |
Distribution on |
Difference in Distribution (1)-(2) |
Distribution on |
Difference in Distribution (1)-(4) |
||||
| (1) $m |
Per cent | (2) $m |
Per cent | (3) $m |
(4) $m |
Per cent | (5) $m |
|
| NSW | 6974 | 30.4 | 7754 | 33.8 | -780 | 8432 | 36.8 | -1458 |
| VIC | 4910 | 21.4 | 5698 | 24.8 | -788 | 5733 | 25.0 | -823 |
| QLD | 4284 | 18.7 | 4255 | 18.5 | 29 | 3661 | 16.0 | 623 |
| WA | 2143 | 9.3 | 2261 | 9.9 | -118 | 2286 | 10.0 | -143 |
| SA | 2176 | 9.5 | 1803 | 7.9 | 373 | 1587 | 6.9 | 589 |
| TAS | 910 | 4.0 | 565 | 2.5 | 344 | 471 | 2.1 | 439 |
| ACT | 412 | 1.8 | 374 | 1.6 | 38 | 555 | 2.4 | -143 |
| NT | 1135 | 4.9 | 234 | 1.0 | 901 | 220 | 1.0 | 916 |
| Total | 22944 | 100.0 | 22944 | 100.0 | 22944 | 100.0 | ||
Table 5 shows the per capita relativities used to distribute the combined pool of FAGs and HCGs since 1994.
Table 5: Commonwealth Grants Commission Relativities, 1994 to 1999
| 1994 Update |
1995 Update |
1996 Update(a) |
1997 Update |
1998 Update(b) |
1999 Report(c) |
Per cent Change 1994-1999 |
|
| NSW | 0.8756 | 0.8743 | 0.87472 | 0.87819 | 0.87765 | 0.89948 | 2.7 |
| VIC | 0.8374 | 0.8506 | 0.87577 | 0.87835 | 0.88042 | 0.86184 | 2.9 |
| QLD | 1.0441 | 1.0435 | 1.04176 | 1.03737 | 1.02186 | 1.00687 | -3.6 |
| WA | 1.0839 | 1.0521 | 1.01409 | 0.99589 | 0.98252 | 0.94793 | -12.5 |
| SA | 1.2186 | 1.2047 | 1.18772 | 1.19100 | 1.22194 | 1.20680 | -1.0 |
| TAS | 1.5173 | 1.5437 | 1.54644 | 1.54974 | 1.55086 | 1.60905 | 6.0 |
| ACT | 0.8968 | 0.8916 | 0.88883 | 0.88435 | 0.95145 | 1.10270 | 23.0 |
| NT | 4.9863 | 5.0332 | 4.87829 | 4.89353 | 4.81869 | 4.84429 | -2.8 |
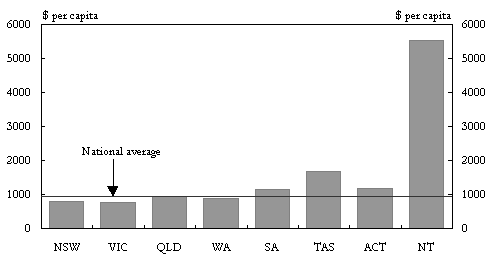
The estimated State distribution of general revenue assistance on a per capita basis for 1999-2000 is shown in Chart 6. It indicates that New South Wales, Victoria and Western Australia receive less than average per capita payments while Queensland receives just above the average level of per capita payments. The Northern Territory receives over five times the national average and Tasmania, the Australian Capital Territory and South Australia also benefit from above average per capita payments.
Chart 6: General Revenue Assistance, 1999-2000
In determining per capita relativities for the distribution of general revenue assistance, the CGC takes account of the interstate distribution of most current Specific Purpose Payments (SPPs). Within the CGC's methodology there are three approaches to dealing with SPPs:
As part of a process to improve the simplification and transparency of the HFE process,
the CGC has changed the terminology in relation to the treatment of SPPs as used in
the 1998 Update. Absorption and Inclusion remain the same as in
the 1998 Update and Deduction has been renamed Exclusion. Previously, the CGC
used the term Exclusion to define SPPs which were directed to areas in which the
Commonwealth had largely accepted financial responsibility (for example, most SPPs
`through' the States) or were outside the scope of the CGC's assessments of recurrent
expenditures and revenues (such as most capital SPPs).
The distribution of SPPs treated by Inclusion or Absorption affects the distribution of
FAGs. Concerns have been expressed that this may in some instances result in the
Commonwealth's policy objectives with respect to SPPs being overridden. The Commonwealth
attempts to balance the objectives of SPPs with the objectives of fiscal equalisation.
Accordingly, the Commonwealth has sometimes instructed the CGC to treat certain SPPs in a
different way from how the CGC may otherwise have treated them. For example, the financial
assistance provided under the Natural Heritage Trust of Australia has been excluded from
the CGC's assessments to ensure that the benefit of the assistance is not partly offset by
a redistribution of FAGs amongst the States.
It is not necessarily the case that the Commonwealth's policy objectives will be forgone
where an SPP's distribution may be overridden over time in a financial sense. The
objective of an SPP may be achieved by the fulfillment of the related conditions which the
Commonwealth has agreed with the State receiving the payment.

