



|
|
|
|
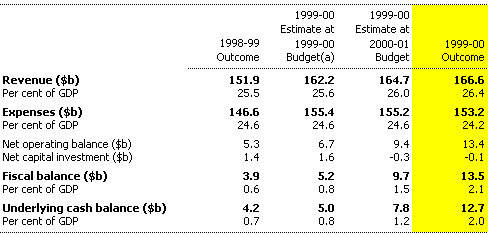
In 1999-2000, the Commonwealth general government sector recorded its largest ever budget surplus, in both cash and accrual terms. This is the third consecutive underlying cash surplus.
Stronger than expected taxation revenue and lower expenses both contributed to the higher than anticipated surplus in 1999-2000. However, while some growth in the tax base contributed to the higher outcome, most of the additional improvement in the budget surplus, relative to expectations for that year at the 2000-01 Budget, was due to one-off events or shifts in the timing of revenues and expenses.
Table 1 provides a summary of the major fiscal aggregates for 1999-2000, as well as a comparison with 1998-99 outcomes and the estimates published in the 1999-2000 and 2000-01 Budgets.
Table 1: General government sector budget aggregates
(a) Adjusted for classification and accounting policy changes to be on a consistent basis with the 2000-01 Budget estimates and the outcome data. Therefore the figures shown are different to those originally published in the 1999-2000 Budget.
Total revenue in 1999-2000 was $166.6 billion, around $2.0 billion (1.2 per cent) higher than the revised estimate of $164.7 billion provided in the 2000-01 Budget.
The tax revenue outcome for 1999-2000 was $152.6 billion, around $2.0 billion (1.3 per cent) higher than estimated at the 2000-01 Budget. This was primarily due to greater than expected revenue from companies and other individuals.
Companies tax revenue for 1999-2000 was around $1.1 billion (4.9 per cent) higher than the 2000-01 Budget estimate. This reflected, in part, stronger than expected company profit growth and the non-payment of a large refund that was anticipated at Budget. There is also evidence of some companies engaging in tax planning activities, possibly resulting in some revenue being brought forward from 2000-01.
Other individuals tax revenue for 1999-2000 was around $0.7 billion (5.3 per cent) higher than the 2000-01 Budget estimate. This reflected slightly stronger than expected provisional income growth, a record number of June lodgements, and increased audit activity by the Australian Taxation Office (ATO), particularly in the area of aggressive tax planning schemes.1
Abstracting from companies and other individuals, tax revenue was around $0.1 billion (0.1 per cent) higher than the 2000-01 Budget estimate. Non-tax revenue in 1999-2000 was $14.0 billion, in line with the 2000-01 Budget forecast.
Total expenses were $153.2 billion in 1999-2000, approximately $2.0 billion lower than estimated at the 2000-01 Budget. This outcome reflects lower than anticipated spending by a number of agencies and across several functions. It includes expenditure that has slipped from 1999-2000 to 2000-01, as well as some other one-off factors. Expenditure on demand-driven programmes (such as personal benefits payments) was largely as forecast at the 2000-01 Budget.
Major areas where expenses were lower than anticipated at the 2000-01 Budget include:
There were some offsets to these lower than anticipated expenses, including:
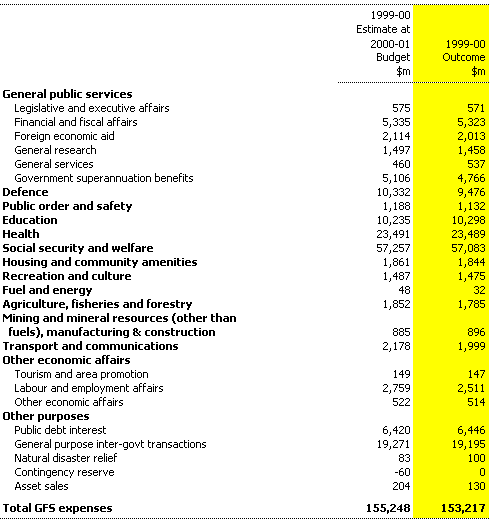
Table 2 provides information on GFS expenses by function. The major variations since the 2000-01 Budget described above are reflected in the functional data.
This is the first time that expenses by function data have been able to be provided on a GFS basis (all previous expenses by function data have been on a AAS31 basis). Therefore, the data referring to the estimates at the 2000-01 Budget did not appear in the budget papers but have been calculated subsequently. Information on AAS31 expenses by function (and sub-function) is provided in Appendix B.
Table 2: Expenses by function - GFS basis
Net capital investment was $0.2 billion higher in 1999-2000 than estimated at the 2000-01 Budget, largely due to variations in the Defence, and Finance and Administration portfolios.
In the Defence portfolio, net capital investment was around $0.4 billion higher than estimated at the 2000-01 Budget. Higher than anticipated purchases of property, plant and equipment ($0.9 billion) were partly offset by higher than forecast proceeds from housing sales by the Defence Housing Authority ($0.1 billion) and lower than forecast investment in inventory ($0.2 billion) and other non-financial assets ($0.2 billion). Together with the $0.7 billion decrease in Defence expenses, this results in a $0.2 billion increase in the fiscal balance.
In the Finance and Administration portfolio, net capital investment was $0.3 billion lower than estimated at the 2000-01 Budget due to lower than forecast property purchases ($0.2 billion) and higher than expected proceeds from the sale of land and buildings ($0.1 billion).
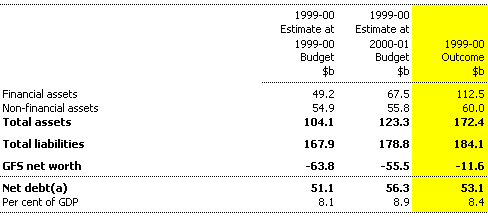
The level of Commonwealth general government net debt fell by $17.5 billion in 1999-2000 to $53.1 billion (8.4 per cent of GDP). Reflecting the higher than expected cash surplus, the 1999-2000 net debt outcome is $3.2 billion lower than was anticipated at the 2000-01 Budget. Net debt has fallen from a high of almost 20 per cent of GDP in 1995-96 to 8.4 per cent of GDP in 1999-2000, with the net reduction totaling $42.7 billion. Commonwealth general government net debt is now at its lowest level since 1991-92.
Table 3: Commonwealth general government sector net worth and net debt
(a) Net debt comprises a sub-set of liabilities (deposits held, advances received and borrowing) less a sub-set of financial assets (cash and deposits, advances paid and investments, loans and placements).
At the end of 1999-2000, Commonwealth general government GFS net worth was -$11.6 billion, $43.9 billion higher than the estimate in the 2000-01 Budget.
This improvement has largely resulted from the move to value the Commonwealth's investments in public corporations (including Telstra) at market prices in the GFS balance sheet. This change has been made to align with the ABS GFS framework. The ABS used a current market value method for Commonwealth investments in its 1998-99 issue (released in July 2000) of Government Finance Statistics (Cat. No. 5512.0). These investments were previously valued at historic cost, as allowed by Australian Accounting Standards. The valuation change has increased financial assets by $40.4 billion
Other factors that contributed to the Commonwealth's improved net worth position since the 2000-01 Budget include:
The positive balance sheet movements have been partly offset by an increase in the Commonwealth's superannuation liability of $4.4 billion since the 2000-01 Budget. This follows a three yearly actuarial reassessment of both civilian and military superannuation schemes undertaken by the Australian Government Actuary in June 2000.
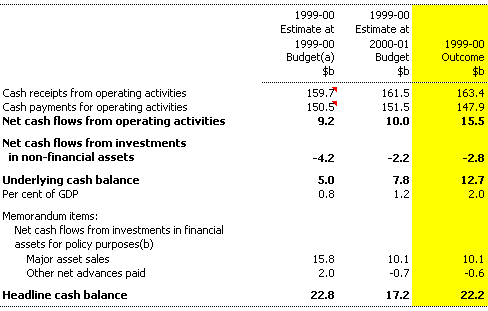
In 1999-2000, the underlying cash balance was a surplus of $12.7 billion, $4.9 billion higher than the estimate in the 2000-01 Budget. The higher than expected outcome is primarily the result of greater operating cash receipts and lower operating cash payments.
Table 4: Summary of Commonwealth general government sector cash flows
(a) Adjusted for classification changes to be on a basis consistent with the 2000-01 Budget estimates.
(b) Under the cash budgeting framework, these cash flows were referred to as 'net advances'.
Many of the variations to accrual revenue and expenses since the 2000-01 Budget described earlier also explain the increase in net operating cash receipts. However, there are also some variations that have differing impacts upon the cash and accrual budget aggregates and these are discussed below.
Cash receipts from operating activities were around $1.9 billion higher than the 2000-01 Budget estimate, which is in line with the accrual revenue variation of around $2.0 billion. However, there are some notable compositional differences between the cash and accrual variations in taxation revenue. In particular, a stronger companies tax outcome in cash terms was largely offset by the fact that most of the additional strength in other individuals tax revenue was in non-cash elements.
Major differences between operating cash payments and expenses since Budget include:
Net cash expenditure on non-financial assets was $2.8 billion, an increase of $0.6 billion from the 2000-01 Budget estimate (which has the effect of reducing the underlying cash balance). This was mainly due to:
The Commonwealth Charter of Budget Honesty Act 1998 requires that the Final Budget Outcome be based on external reporting standards, and that departures from applicable external reporting standards be identified.
The major external standards used in the Final Budget Outcome are the ABS accrual Government Finance Statistics (GFS) framework and Australian Accounting Standards, including Australian Accounting Standard No. 31 Financial Reporting by Governments (AAS31).
The GFS reporting framework is a specialised statistical system designed to support economic analysis of the public sector. It allows comprehensive assessments to be made of the economic impact of government and is consistent with international statistical standards. The major budget aggregates are drawn from the GFS framework.
AAS31 requires governments to prepare accrual-based general purpose financial reports, including in relation to the assets they control, any liabilities incurred, and their revenues and expenses. This reporting is intended to provide a consolidated overview of the financial performance and position of government, including in the area of financing and investing activities. Users are not able to obtain this overview by analysing all of the individual financial reports of the many entities controlled by Commonwealth, State and Territory governments due to the existence of intra-government transactions.
Under AAS31, governments must prepare an operating statement (also known as a statement of revenues and expenses, or profit and loss statement), a statement of financial position (or balance sheet) and a statement of cash flows.
Attachment B provides a reconciliation between GFS and AAS31 aggregates.
The GFS and AAS31 financial statements in the Final Budget Outcome are generally consistent with the ABS GFS framework and accounting policies in AAS31 respectively.
The GFS framework requires that flows and stocks are valued at current market prices (or where these are not observable, a suitable proxy indicator). While this is the case for flows in the operating statement and the cash flow statement, not all assets and liabilities in the GFS balance sheet are currently valued at current market prices. This is principally because Australian Accounting Standards allow asset and liability valuation methods other than current market prices (such as historic cost). In the early years of accrual budgeting the focus has been on preparing robust GFS operating and cash flow statements. Refinements to the GFS balance sheet valuations of assets and liabilities will be considered over time, in consultation with the ABS, as the new framework is bedded down.
Additional information on the consistency of the Final Budget Outcome with AAS31 is provided in Part II (see Note 1 to the financial statements).
There is a general consistency of treatment between GFS and accounting standards. The GFS and AAS31 definitions of the scope of the public sector are similar in almost all cases. AAS31 recommends the same segmentation of the public sector into general government, public non-financial corporations (PNFC) and public financial corporations (PFC) sectors. The general government sector and PNFCs together make up the non-financial public sector (NFPS).
Transactions are generally treated in a similar manner by GFS and accounting standards; however, where GFS is a framework designed to facilitate macro-economic analysis, AAS31 is designed as a standard for general purpose financial reporting. The different objectives of the two systems lead to some variation in the treatment of certain items.
In particular, revaluations of financial and non-financial assets and liabilities are classified differently under the AAS31 and GFS standards. Major revaluations include: writedowns of bad and doubtful debts (excluding those that are mutually agreed); changes in the valuation of superannuation liabilities; and foreign exchange gains and losses.
Under AAS31 reporting, valuation changes may affect revenues or expenses. However, under GFS reporting revaluations are not considered to be transactions (that is, they are considered to be other economic flows) and accordingly do not form part of revenues or expenses. Therefore, most revaluations are not taken into account in the calculation of the GFS net operating balance or fiscal balance.
Some of the major differences between the GFS and AAS31 treatments of transactions are outlined in Table 5. Further information on the differences between the two systems is provided in the ABS information paper Accruals-based Government Finance Statistics (Cat. No. 5517.0).
Table 5: Selected differences between AAS31 and GFS reporting standards
Issue
AAS31 Treatment
GFS Treatment
Provisions for bad and doubtful debts and asset writedowns
Treated as part of operating expenses.
Treated as revaluations, except for mutually agreed writedowns, and therefore are removed from operating expenses.
Profit/loss on sale of assets
Treated as part of operating revenues/expenses.
Treated as revaluations and therefore are removed from operating revenues/expenses.
Interest flows related to swaps and other financial derivatives
Treated as operating revenues and expenses.
Treated as financing transactions and hence not included in operating revenues and expenses.
Benefits to households in goods and services (social transfers in kind) component of personal benefits payments
All personal benefits payments are treated as transfers in operating expenses.
Personal benefits payments that are not paid as direct cash transfers are treated as part of other expenses in the operating statement.
Regulatory Fees
Included in non-taxation revenue.
Predominantly treated as user charges and included in the `Sales of Goods and Services' component of non-taxation revenue.
Fines
Included in non-taxation revenue.
Treated as transfer income as part of non-taxation revenue.
Public debt net interest
Under accounting standards, premia and discounts on the repurchase of debt are included in public debt net interest at the time of repurchase, regardless of whether the stock is cancelled at that time. Issue premia and discounts are amortised over the life of the stock.
Repurchase premia and discounts are treated as economic revaluations at the time the debt is repurchased (provided it is valued at historical cost). The GFS cash flow statement includes repurchase premia or discounts in the year that the repurchased stock is cancelled or matures.
Finance Leases
Treats finance leases as if an asset were purchased from borrowings ie the lease payment is split into an interest component (which is shown as an operating expense) and a principal component.
The asset and the liability are recorded on the balance sheet.
However, this convention does not apply to the cash flow statement, which does not record the acquisition of the asset or the liability.
As per the accounting standard, except that the GFS cash flow statement includes the acquisition of the asset and the liability.
Table 6 reconciles GFS revenue and expenses (which appear in Parts I and III) with their AAS31 counterparts (which are reported in Part II).
Table 6: Reconciliation of GFS and AAS31 revenue and expenses
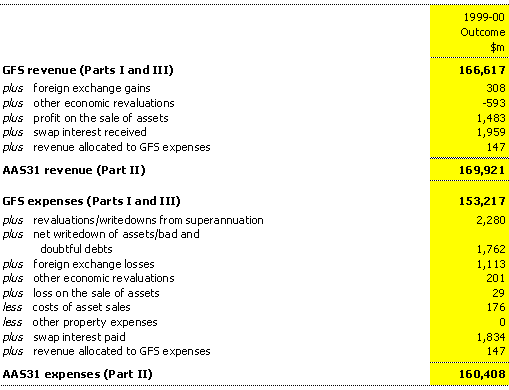
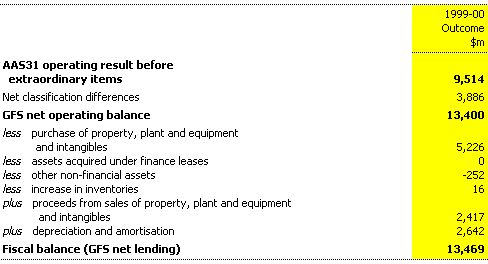
Table 7 reconciles the accounting operating result to the GFS net operating balance and the fiscal balance (GFS net lending).
The reconciliation can be divided into two parts. The first part shows classification differences between the AAS31 operating result before extraordinary items and the GFS net operating balance. (The classification differences are those shown in Table 6.)
The second part of the reconciliation shows the adjustment for net capital investment required to derive the fiscal balance from the GFS net operating balance. Net capital investment is measured as net purchases of property, plant and equipment, plus net investment in other non-financial assets less depreciation.
Table 7: Reconciliation of AAS31 net operating
result and
fiscal balance
The major budget aggregates are based on the ABS accrual GFS framework. The following section provides a brief overview of this framework and the major fiscal aggregates. Additional information on the accrual GFS framework is available in the ABS publication Information Paper: Accruals-based Government Finance Statistics, 2000 (Cat. no. 5517.0)
The GFS framework requires that flows and stocks are valued at current market prices (or where these are not observable, a suitable proxy indicator).
The accrual GFS framework is based on an integrated recording of flows and stocks. Flows reflect the creation, transformation, exchange, transfer or extinction of economic value. They involve changes in the volume, composition or value of a unit's assets, liabilities and net worth. Stocks refer to a unit's holdings of assets, liabilities and net worth at a point in time.
Two types of flows are distinguished: transactions and other economic flows.
The operating statement presents details of transactions in GFS revenues, GFS expenses and the net acquisition of non-financial assets (net capital investment) for an accounting period.
GFS revenues are broadly defined as transactions that increase net worth and GFS expenses as transactions that decrease net worth.
Net acquisition of non-financial assets equals gross fixed capital formation, less depreciation, plus changes (investment) in inventories and plus other transactions in non-financial assets.
Fiscal balance (or GFS net lending/borrowing) is an analytical balance in the GFS operating statement. It is calculated as revenues less expenses less the net acquisition of non-financial assets. It measures in accrual terms the gap between government savings plus net capital transfers and investment in non-financial assets. As such, it measures the contribution of the Commonwealth general government sector to the balance on the current and capital accounts in the balance of payments.
A fiscal balance surplus indicates that the Commonwealth is placing financial resources at the disposal of other sectors (ie it is lending). A fiscal deficit indicates that the Commonwealth is utilising the financial resources of other sectors (ie it is borrowing). Thus, fiscal balance can be viewed as a global indicator of the financial impact of Commonwealth Government operations on the rest of the economy.
The balance sheet shows stocks of assets, liabilities and GFS net worth. Net debt is also reported in the balance sheet.
Net worth for the general government sector is defined as assets less liabilities. (For the public financial corporations (PFC) and public non-financial corporations (PNFC) sectors the formula becomes assets less liabilities less shares and other contributed capital.) Net worth is an economic measure of wealth. It reflects the contribution of the Commonwealth to the wealth of Australia.
Net debt is defined as the sum of selected financial liabilities (deposits held; advances received; and borrowing) minus the sum of selected financial assets (cash and deposits; advances paid; and investments, loans and placements). Net debt measures the indebtedness of the Commonwealth.
The cash flow statement identifies how cash is generated and applied in a single accounting period. `Cash' means cash on hand (notes and coins held and deposits held at call with a bank or other financial institution) and cash equivalents (highly liquid investments that are readily convertible to cash on hand at the investor's option and overdrafts considered integral to the cash management function).
The cash flow statement reflects a cash basis of recording (rather than an accrual basis) where the information has been derived indirectly from underlying accrual transactions and movements in balances. This, in effect, means that transactions are captured when cash is received or when cash payments are made. Cash transactions are specifically identified because cash management is considered an integral function of accrual budgeting.
The underlying cash balance (GFS surplus/deficit) is an analytical balance in the cash flow statement. For the general government sector it is calculated as:
Net cash flows from operating activities
plus net cash flows from investments in non-financial assets
less acquisitions of assets acquired under finance leases and similar arrangements
The underlying cash balance is the cash based counterpart of the fiscal balance. It is a broad indicator of the Commonwealth's cash flow requirements. An underlying cash surplus reflects the extent to which cash is available to the Commonwealth to either increase its financial assets or decrease its liabilities (assuming no revaluations and other changes occur). An underlying cash deficit measures the extent to which the Commonwealth requires cash, either by running down its financial assets or by drawing on the cash reserves of other sectors.
The underlying cash balance measure described here is conceptually the same as the underlying cash balance used in the former cash budgeting system. In practice, however, the underlying cash balance in the accrual framework is derived using different methodologies, which results in a break in the time series across the two systems.
Data are presented by institutional sector. Institutional sector distinguishes between the general government sector, the PNFC sector and the PFC sector.
Budget reporting focuses on the general government sector. This sector provides public services that are mainly non-market in nature, and for the collective consumption of the community, or involve the transfer or redistribution of income. These services are largely financed through taxes and other compulsory levies, although user charging and external funding have increased in recent years. This sector comprises all government departments, offices and some other bodies.
The PNFC sector comprises bodies that provide goods and services that are mainly market, non-regulatory and non-financial in nature, financed predominantly through sales to the consumers of these goods and services. In general, PNFCs are legally distinguishable from the governments that own them. The PNFC sector includes Australia Post, Port Authorities and Railways.
Together the general government sector and the PNFC sector comprise the non-financial public sector.
The GFS coverage of the public sector also includes PFCs. These bodies are engaged in financial intermediation services or auxiliary financial services. They are able to incur financial liabilities on their own account. This sector includes the Reserve Bank of Australia.
The total public sector comprises all sectors of government - general government, the PNFC sector and the PFC sector.
1 In particular, on 15 June 2000, the Tax Commissioner announced the release of an income tax ruling on `tax shelters' (TR 2000/8) addressing issues found in a wide variety of investment schemes including various afforestation and other primary production schemes, film and franchise schemes.
2 The new company tax payment arrangements under the PAYG system have brought company tax payments from the 2000-01 income year forward relative to the previous arrangements. This transition has caused an overlap of company tax payments in the 2000-01 financial year for most companies. However, for companies with early December balancing dates, the overlap occurred in 1999-2000. Under the PAYG transitional arrangements, companies are allowed to defer cash payment of some of the additional tax liabilities arising from the overlap over the following 2½ to 5 years.
