



|
|
|
|
The Commonwealth, states and territories have an agreed framework - the Accrual Uniform Presentation Framework (UPF) - for the presentation of government financial information on a basis consistent with the ABS Government Finance Statistics (GFS) publication. Data in this part are presented in accordance with this framework.
From 1999-2000 onwards, the ABS is compiling GFS data on an accrual accounting rather than a cash accounting basis. This accrual GFS framework reflects the principles contained in the international standards set out in the United Nations' (UN) A System of National Accounts, 1993 (SNA93), and in the International Monetary Fund's (IMF) A Manual on Government Finance Statistics (currently under revision). The first presentation by the ABS of public finance statistics on an accrual accounting basis was in the April 2000 issue of Government Financial Estimates, Australia for 1999-2000 (Cat. No. 5501.0).
Table 11: General government sector operating statement
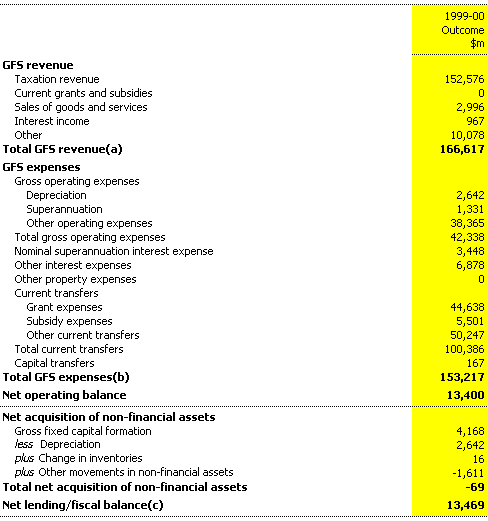
(a) GFS revenue is not equal to AAS31 revenue. GFS revenue
includes all (mutually agreed) transactions that increase net worth. Revaluations
are not considered mutually agreed transactions, and so are excluded from GFS
revenue. Asset sales, which involve a transfer of a non-financial asset for
a financial asset, are also excluded.
(b) GFS expenses are not equal to AAS31 expenses. GFS
expenses include all (mutually agreed) transactions that decrease net worth.
Revaluations are not considered mutually agreed transactions, and so are excluded
from GFS expenses.
(c) GFS net lending also equals net transactions in financial
assets less net transaction in liabilities. The term `fiscal balance' is not
used by the ABS.
Table 12: General government sector balance sheet
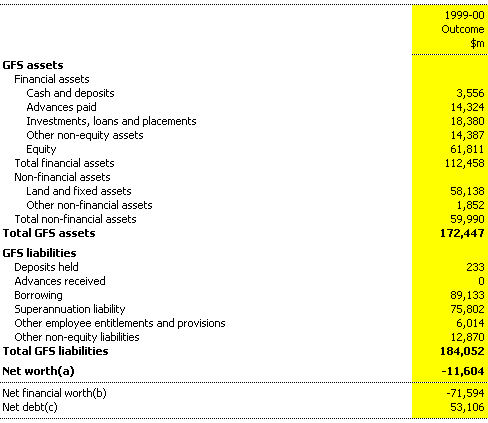
(a) Net worth is calculated as assets minus liabilities.
(b) Net financial worth equals total financial assets
minus total liabilities.
(c) Net debt equals the sum of deposits held, advances
received and borrowing, minus the sum of cash deposits, advances paid and investments,
loans and placements.
Table 13: General government sector cash flow statement(a)
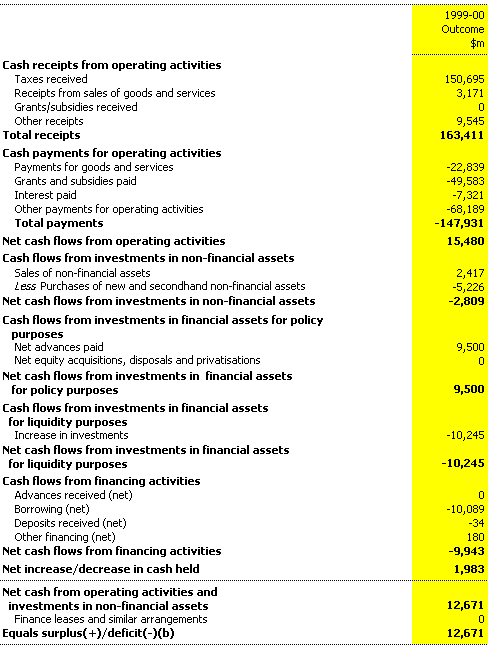
(a) A positive number denotes a cash inflow; a negative sign
denotes a cash outflow.
(b) Conceptually, the surplus/deficit aggregate contained
in the cash flow statement is the same as the deficit measure obtained under
the UPF. However, in practice, the process of deriving these aggregates differs
so that the measures are not directly comparable. Time series data created by
splicing these measures together should therefore be used with caution.
Table 14: Public non-financial corporations sector operating statement
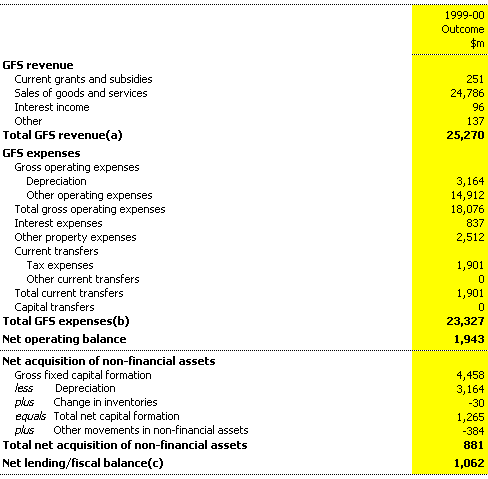
(a) GFS revenue is not equal to AAS31 revenue. GFS revenue
includes all (mutually agreed) transactions that increase net worth. Revaluations
are not considered mutually agreed transactions, and so are excluded from GFS
revenue. Asset sales, which involve a transfer of a non-financial for a financial
asset, are also excluded.
(b) GFS expenses are not equal to AAS31 expenses. GFS
expenses include all (mutually agreed) transactions that decrease net worth.
Revaluations are not considered mutually agreed transactions, and so are excluded
from GFS expenses.
(c) GFS net lending also equals net transactions in financial
assets less net transactions in liabilities. The term `fiscal balance' is not
used by the ABS.
Table 15: Public non-financial corporations sector balance sheet
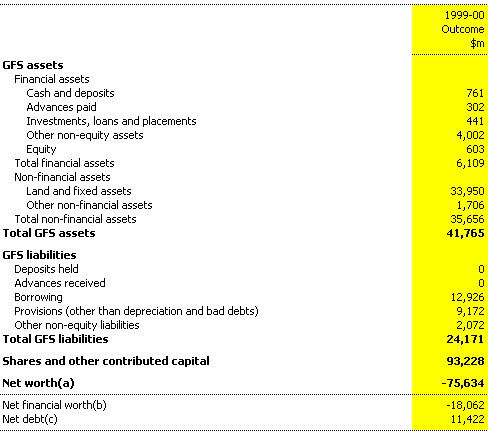
(a) Net worth is calculated as assets minus liabilities minus
shares and other contributed capital.
(b) Net financial worth equals total financial assets
minus total liabilities.
(c) Net debt equals the sum of deposits held, advances
received and borrowing, minus the sum of cash deposits, advances paid and investments,
loans and placements.
Table 16: Public non-financial corporations sector cash flow statement(a)
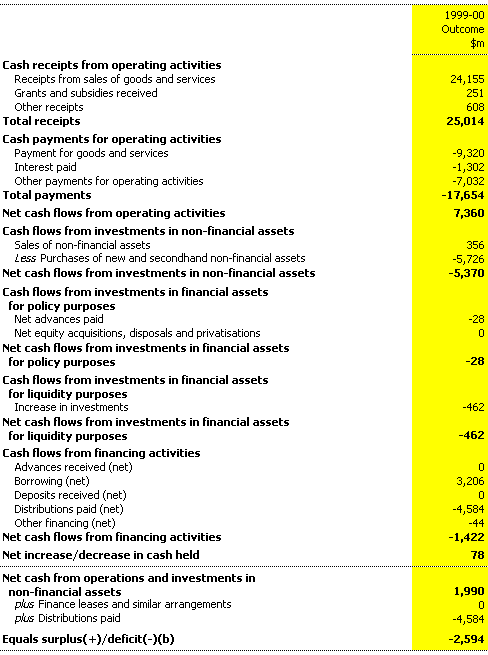
(a) A positive number denotes a cash inflow; a negative sign
denotes a cash outflow.
(b) Conceptually, the surplus/deficit aggregate contained
in the cash flow statement is the same as the deficit measure obtained under
the UPF. However, in practice, the process of deriving these aggregates differs
so that the measures are not directly comparable. Time series data created by
splicing these measures together should therefore be used with caution.
Table 17: Non-financial public sector operating statement
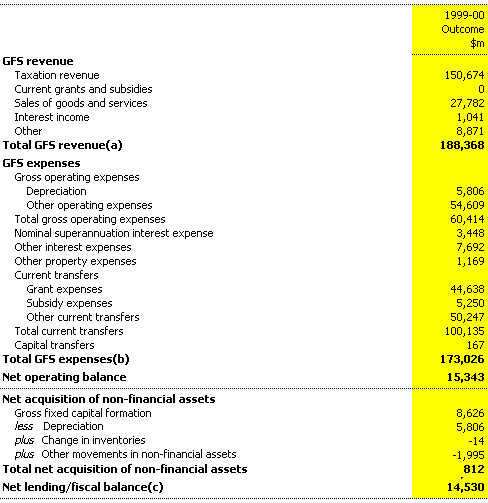
(a) GFS revenue is not equal to AAS31 revenue. GFS revenue
includes all (mutually agreed) transactions that increase net worth. Revaluations
are not considered mutually agreed transactions, and so are excluded from GFS
revenue. Asset sales, which involve a transfer of a non-financial for a financial
asset, are also excluded.
(b) GFS expenses are not equal to AAS31 expenses. GFS
expenses include all (mutually agreed) transactions that decrease net worth.
Revaluations are not considered mutually agreed transactions, and so are excluded
from GFS expenses.
(c) GFS net lending also equals net transactions in financial
assets less net transactions in liabilities. The term `fiscal balance' is not
used by the ABS.
Table 18: Non-financial public sector balance sheet
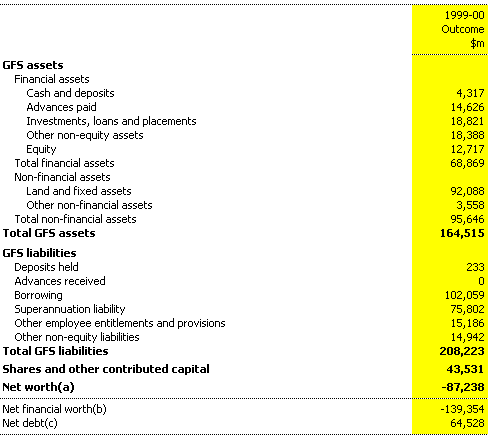
(a) Net worth is calculated as assets minus liabilities minus
shares and other contributed capital.
(b) Net financial worth equals total financial assets
minus total liabilities.
(c) Net debt equals the sum of deposits held, advances
received and borrowing, minus the sum of cash deposits, advances paid and investments,
loans and placements.
Table 19: Non-financial public sector cash flow statement(a)
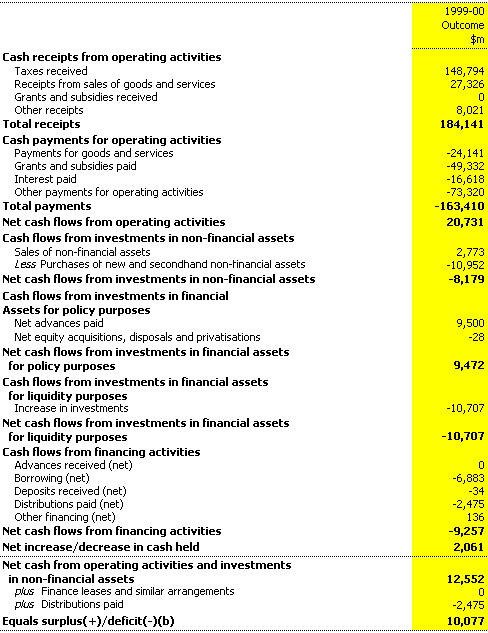
(a) A positive number denotes a cash inflow; a negative sign
denotes a cash outflow.
(b) Conceptually, the surplus/deficit aggregate contained
in the cash flow statement is the same as the deficit measure obtained under
the UPF. However, in practice, the process of deriving these aggregates differs
so that the measures are not directly comparable. Time series data created by
splicing these measures together should therefore be used with caution.
Table 20: Public financial corporations sector operating statement
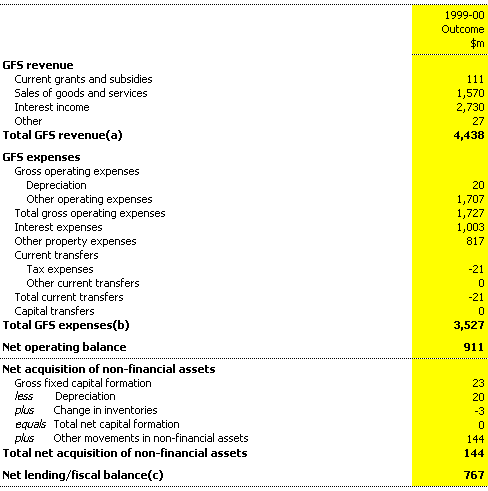
(a) GFS revenue is not equal to AAS31 revenue. GFS revenue
includes all (mutually agreed) transactions that increase net worth. Revaluations
are not considered mutually agreed transactions, and so are excluded from GFS
revenue. Asset sales, which involve a transfer of a non-financial for a financial
asset, are also excluded.
(b) GFS expenses are not equal to AAS31 expenses. GFS
expenses include all (mutually agreed) transactions that decrease net worth.
Revaluations are not considered mutually agreed transactions, and so are excluded
from GFS expenses.
(c) GFS net lending also equals net transactions in financial
assets less net transactions in liabilities. The term `fiscal balance' is not
used by the ABS.
Table 21: Public financial corporations sector balance sheet
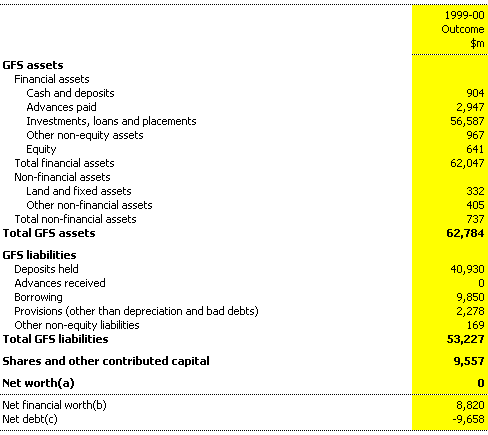
(a) Net worth is calculated as assets minus liabilities minus
shares and other contributed capital.
(b) Net financial worth equals total financial assets
minus total liabilities.
(c) Net debt equals the sum of deposits held, advances
received and borrowing, minus the sum of cash deposits, advances paid and investments,
loans and placements.
Table 22: Public financial corporations sector cash flow statement(a)
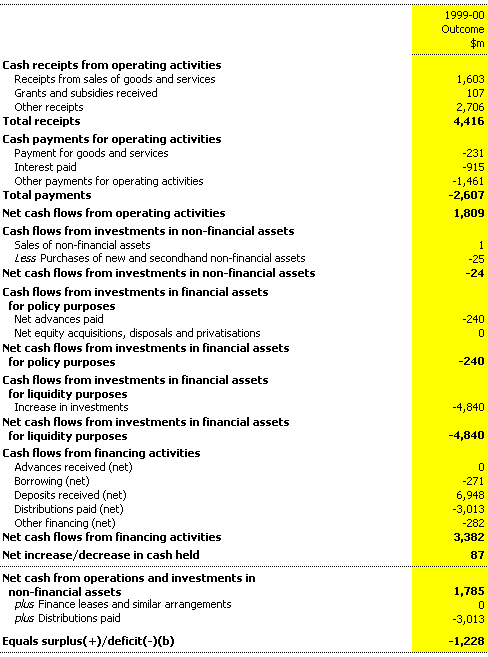
(a) A positive number denotes a cash inflow; a negative sign
denotes a cash outflow.
(b) Conceptually, the surplus/deficit aggregate contained
in the cash flow statement is the same as the deficit measure obtained under
the UPF. However, in practice, the process of deriving these aggregates differs
so that the measures are not directly comparable. Time series data created by
splicing these measures together should therefore be used with caution.
The UPF also requires publication of data on general government sector expenses by function. The data are not shown in this part as they have been published earlier, in Table 2 in Part I.
Under Loan Council arrangements, every year the Commonwealth and each state and territory nominate a Loan Council Allocation (LCA). A jurisdiction's LCA incorporates:
LCA nominations are considered by the Loan Council, having regard to each jurisdiction's fiscal position and reasonable infrastructure requirements, as well as the macroeconomic implications of the aggregate figure.
The Commonwealth nominated, and the Loan Council endorsed, an LCA surplus for 1999-2000 of $14.4 billion. In its May 1999 Budget the Commonwealth estimated an increased LCA surplus of $22.3 billion. The difference between the two estimates reflected an improvement in the general government surplus, primarily due to changes in the proposed method and timing of the sale of Telstra.
As set out in Table 23, the Commonwealth's 1999-2000 LCA outcome is a $21.5 billion surplus, compared with the 1999-2000 Budget estimate of $22.3 billion. There has been a decrease in net cash flows from investments in financial assets for policy purposes. This change reflects a move in the timing of receipts from the sale of the second tranche of Telstra, with the final instalment of payments for Telstra 2 shares due in 2000-01 rather than 1999-2000 as anticipated in the 1999-2000 Budget.
Table 23: Commonwealth Loan Council Allocation for 1999-2000
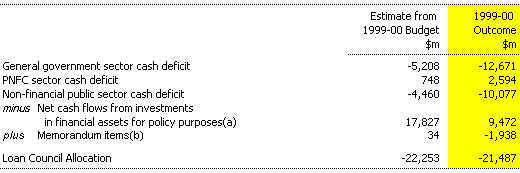
(a) Such transactions involve the transfer or exchange of a
financial asset and are not included within the cash deficit. However, the cash
flow from investments in financial assets for policy purposes has implications
for a government's call on financial markets.
(b) For the Commonwealth, memorandum items comprise the
change in net present value (NPV) of operating leases (with NPV greater than
$5 million), university borrowings, overfunding of superannuation and an
adjustment to exclude the net financing requirements of statutory marketing
authorities and Telstra from the LCA.
